The Roles & Responsibilities Report HR dashboard template provides a clear overview of employee roles, responsibilities, and workload distribution within the organization. It helps HR teams efficiently manage tasks, identify resource gaps, and streamline workforce planning. With insightful visuals and key metrics, this dashboard ensures transparency and alignment across departments for improved organizational efficiency.
Company Hierarchy Overview
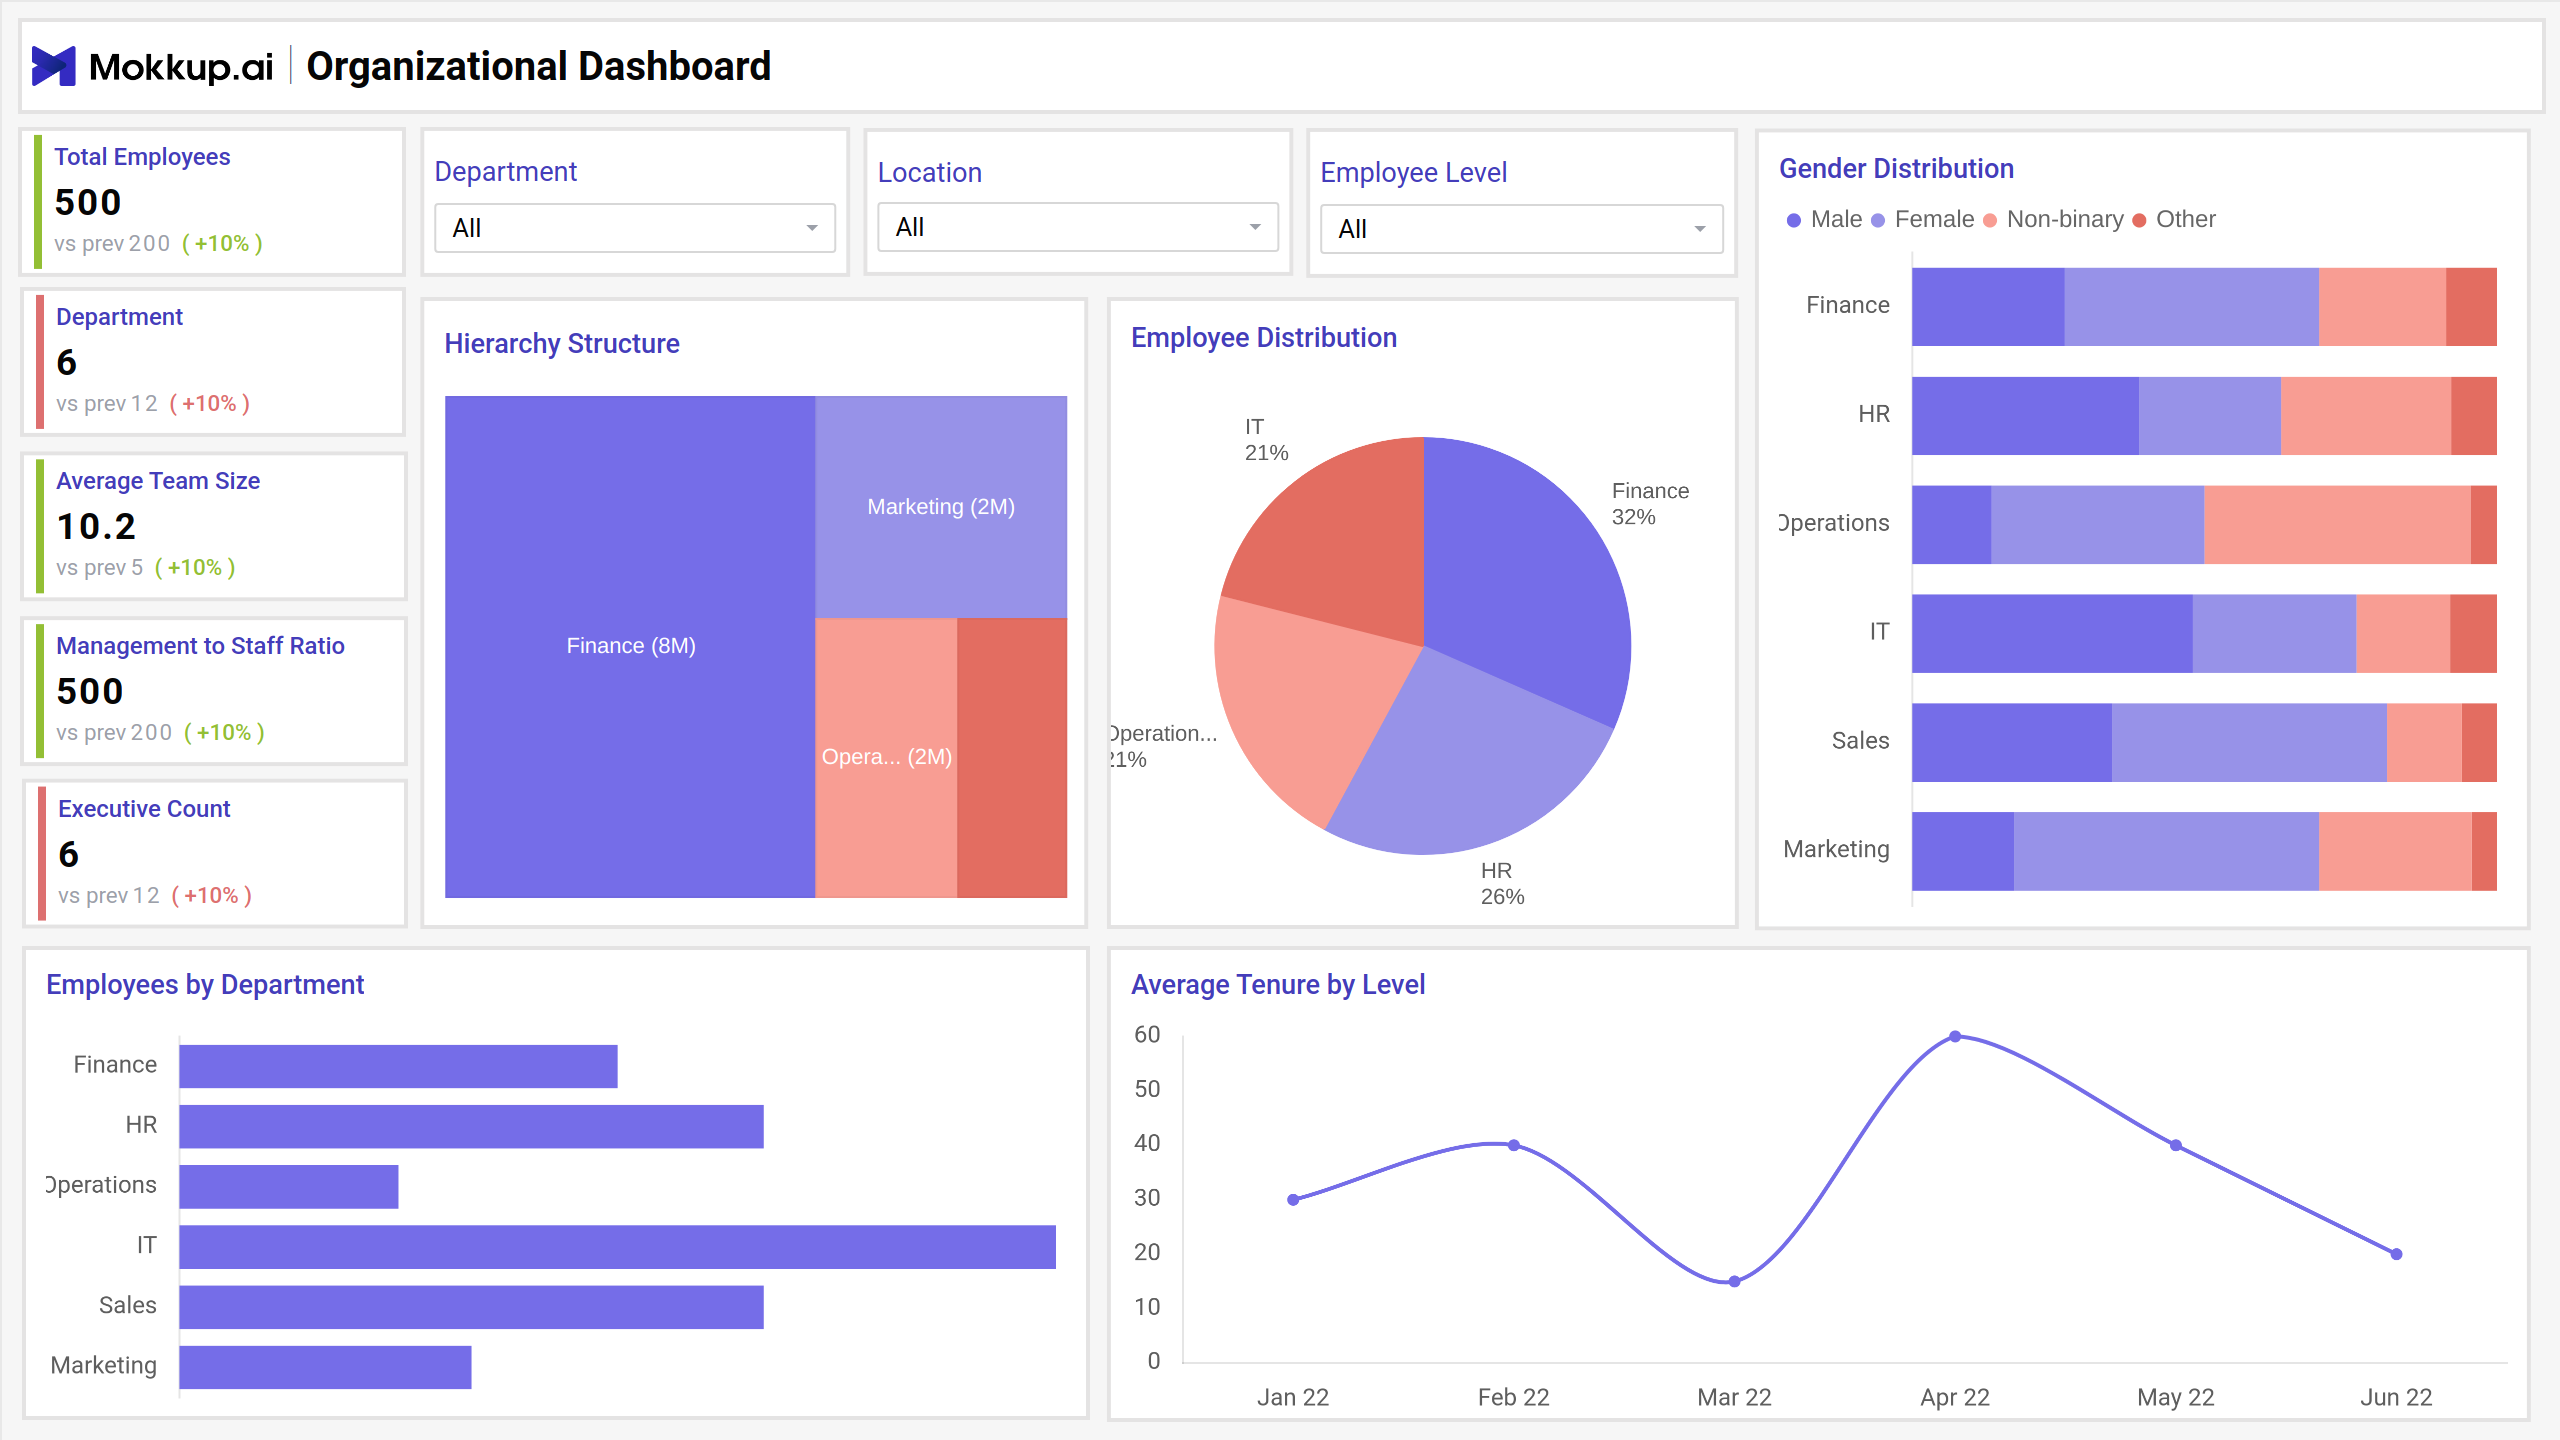
The view provides insights into workforce metrics, including total employees, departmental distribution, and gender representation. It visualizes key data such as hierarchy structure, employee distribution by department, and average tenure trends. This dashboard helps HR teams monitor staffing, diversity, and organizational structure for better decision-making and resource planning.
Key Terms to Know
- Total Employees: Displays the total headcount of employees, highlighting workforce size trends.
- Department: Shows the number of departments within the organization, tracking structural divisions.
- Average Team Size: Reflects the average number of employees per team, indicating team efficiency.
- Management to Staff Ratio: Highlights the balance between managerial roles and staff members.
- Executive Count: Represents the total number of executives, emphasizing leadership structure.
- Hierarchy Structure: Visualizes departmental workforce distribution across the organization.
- Employee Distribution: Pie chart showcasing the percentage split of employees by departments.
- Gender Distribution: Illustrates workforce diversity by gender across different departments.
- Employees by Department: Bar chart showing the employee count in each department.
- Average Tenure by Level: Line graph tracking the average employee tenure across different levels over time.
Departmental Insights
This screen provides a comprehensive overview of organizational workforce data through clear visualizations and metrics. It helps analyze trends, monitor performance, and gain valuable insights to support decision-making, ensuring better understanding and management of the workforce structure across different levels and departments.
Key Terms to Know
- Department with Most Employees: Displays the department with the highest employee count and its growth trend.
- Average Tenure Across Company: Indicates the average duration employees have stayed in the company.
- Highest Employee Retention: Highlights the department with the best employee retention performance.
- Department with Most New Hires: Shows the department that recently recruited the most employees.
- Average Management Tenure: Represents the average length of time management-level employees have been with the company.
- Retention Rate by Department: Compares retention rates across various departments.
- Tenure Distribution: Breaks down employees by their duration of employment, categorized into ranges.
- New Hires by Department: Displays the distribution of new hires by department and role type.
- Employee Count by Level: Illustrates the number of employees segmented into Executive, Management, and Staff levels.
- Employee Age by Level: Analyzes employee age patterns across different organizational levels
Employee Diversity and Inclusion
This screen offers a comprehensive overview of diversity within the organization, highlighting key metrics such as gender balance, ethnic diversity, and age group distribution. It also provides insights into diversity by location, department, and levels, along with retention trends across diversity metrics for informed decision-making.
Key Terms to Know
- Diversity Index: Indicates the overall percentage of diversity within the organization, showing growth compared to previous data.
- Gender Balance: Displays the ratio of male, female, and non-binary employees, highlighting gender distribution trends.
- Average Age: Reflects the average age of employees across the organization, indicating age demographics.
- Top Age Group: Highlights the most dominant age group within the workforce, with comparisons to previous data.
- Highest Ethnic Diversity: Points out the department or level with the most ethnic diversity representation.
- Ethnic Diversity by Level: Shows the distribution of employees by ethnicity across different organizational levels.
- Age Group Distribution: Represents employee age categories as percentages, offering insights into workforce age trends.
- Gender Diversity by Department: Breaks down gender representation within each department, including male, female, and non-binary employees.
- Diversity by Location: Compares ethnic, cultural, and language diversity across different geographic locations.
- Retention by Diversity Metrics: Tracks retention rates segmented by diversity parameters across organizational levels.
Dashboard Template Insights
This dashboard wireframe provides key insights to help HR teams:
- The template highlights specific roles and responsibilities, ensuring clarity in team structure and task distribution.
- It provides an at-a-glance view of the responsibilities assigned to each team member, enhancing organizational transparency.
- With easy-to-read visualizations, HR managers can quickly assess role alignment and task performance across teams.
- The dashboard displays key metrics related to roles, helping HR teams make informed decisions about workload distribution and role adjustments.
Conclusion
This dashboard template streamlines role management and enhances decision-making by offering a comprehensive, data-driven overview. It empowers HR teams to ensure clarity in role assignments, improve task efficiency, and optimize workforce planning, leading to better organizational outcomes.