What is an HR Management Analysis Dashboard?
An HR Management Analysis Dashboard is a visual reporting tool designed to help HR teams monitor key metrics related to workforce performance, employee demographics, and organizational structure. By centralizing employee data, this HR management dashboard allows HR professionals and business leaders to analyze performance trends, evaluate hiring patterns, and optimize decision-making through data visualization.
The dashboard provides a clear overview of essential HR indicators such as headcount, gender ratio, employee pay, and experience distribution. It enables teams to visualize employee performance data and identify areas where employee engagement, retention, or resource allocation can be improved.
Built for both HR managers and executives, the HR dashboard for business leaders eliminates the need for manual data tracking, enabling real-time insight into the organization’s human capital.
How to Create an HR Management Analysis Dashboard
You don’t need to build your report from scratch—just start with a ready-to-use dashboard template from Mokkup. Add in your data and export it however you like. Here’s how to do it:
1. Create or Log in to Your Mokkup Account
Start by signing up on Mokkup.ai using your email. If you already have an account, just log in, and you’ll be good to go.
2. Choose and Customize Your Dashboard Template
Find the HR Management Analysis Dashboard template in the Templates section. Use the drag-and-drop editor to adjust KPIs, edit filters, or add elements based on your data.
3. Export to Your BI Tool
Once your dashboard wireframe is ready, use the BI Tool Export feature to send it directly to Power BI or Tableau for further analysis and enhancements. You can also download the dashboard as a PDF, PNG, or JPEG, embed it on a platform, or invite your team to collaborate.
Note: This is a Pro template. You’ll need a Pro subscription on Mokkup to use and customize this dashboard wireframe. Upgrade anytime to unlock full access.
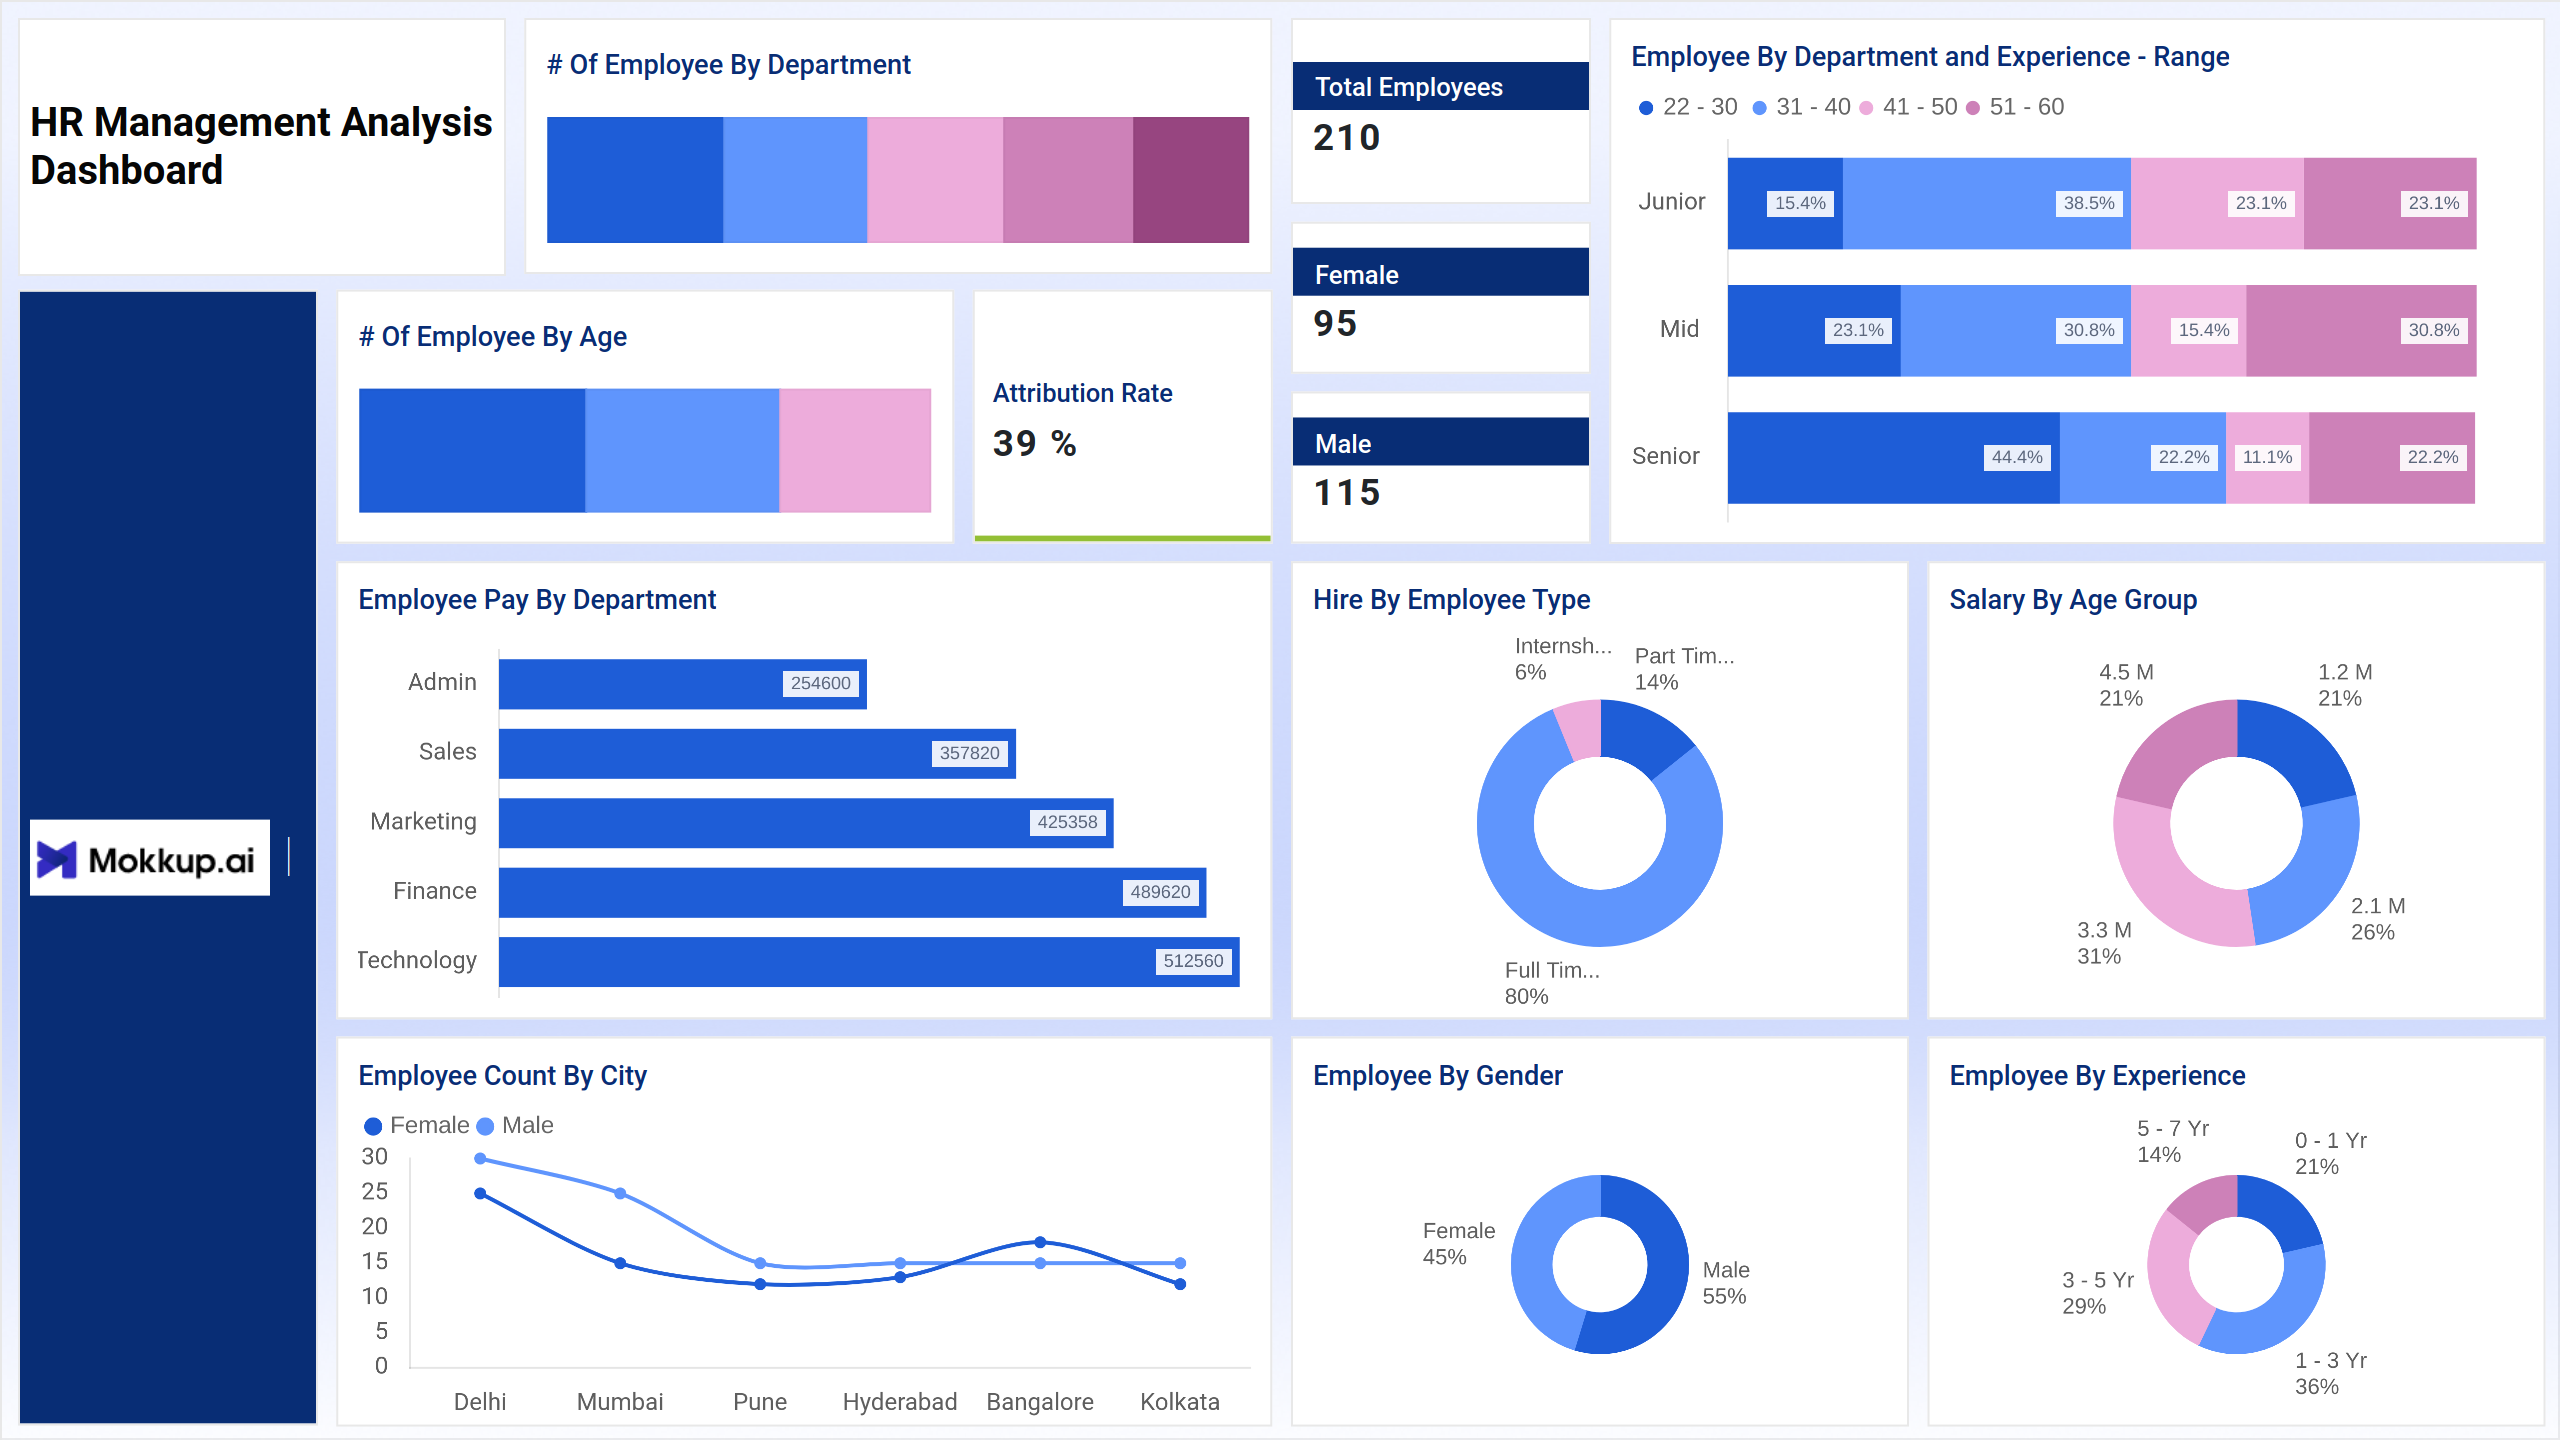
HR Management Analysis Dashboard Example
The HR Management Analysis Dashboard example shown above provides a comprehensive view of workforce analytics through various interactive visual elements. It utilizes bar charts, donut charts, and a line chart to present HR metrics in a clear and easy-to-read format.
For instance, bar charts are used to compare the number of employees by department, employee pay by department, and number of employees by age, allowing HR managers to quickly assess workforce distribution and pay structures. Donut charts display insights such as hire by employee type, employee by gender, salary by age group, and employee by experience, offering a quick breakdown of workforce composition. The line chart visualizes the employee count by city, enabling HR professionals to understand how the workforce is distributed across different locations.
This dashboard is designed for HR professionals who require a centralized platform for performing employee performance analytics. It provides a clear visual summary of every essential HR metric, enabling business leaders to make informed and data-driven workforce decisions.
How to Analyze Data in HR Management Analysis Dashboards
Here is how you can analyze data in this dashboard:
- Monitor Departmental Distribution: Track how employees are spread across departments to balance workload and resources.
- Assess Pay Gaps: Utilize employee pay data by department to ensure equitable salary structures.
- Review Experience Mix: Analyze experience range data to identify skill gaps or training needs.
- Track Hiring Trends: Use the “Hire by Employee Type” chart to understand workforce composition—full-time, part-time, or interns.
- Compare City-wise Data: The “Employee Count by City” chart helps evaluate hiring needs in specific locations.
- Analyze Attrition Rate: Track employee turnover to inform and improve retention strategies.
These insights enable HR leaders to make data-driven workforce management decisions that align with organizational goals.
Benefits of HR Management Analysis Dashboards
By utilizing this HR management analysis dashboard, HR teams gain a strategic advantage through clear data and actionable insights. Here are benefits of integrating this dashboard:
- Centralized Workforce Analytics: Access all employee metrics in one unified dashboard.
- Real-Time Decision Support: Get updated insights for faster, evidence-based HR actions.
- Enhanced Transparency: Improve communication with leadership through clear data visualization.
- Performance Optimization: Identify trends that impact employee productivity and engagement.
- Improved Resource Allocation: Distribute workforce and budgets efficiently across departments.
KPIs to Track in HR Management Analysis Dashboards
- Number of Employees by Department – Understand workforce distribution across teams.
- Number of Employees by Age – Track diversity and generational representation.
- Employee by Department and Experience Range – Evaluate experience mix within each department.
- Employee Pay by Department – Assess pay structure and identify salary trends.
- Employee Count by City – Analyze geographic spread and regional workforce balance.
- Hire by Employee Type – Monitor proportions of full-time, part-time, and internship roles.
- Salary by Age Group – Correlate pay with employee age groups for fairness analysis.
- Employee by Gender – Review gender diversity and inclusivity levels.
These KPIs collectively provide a complete view of HR performance and organizational health.
Frequently Asked Questions
1. Who can use an HR Management Analysis Dashboard?
HR managers, business leaders, and executives use it to track workforce metrics, performance, and diversity insights.
2. How does the HR dashboard support employee performance analytics?
It consolidates employee data—experience, department, and pay—into visual reports that reveal trends impacting productivity.
3. Why is visualization important in HR analytics?
Data visualization simplifies complex datasets, helping HR professionals make decisions faster and communicate insights effectively.