
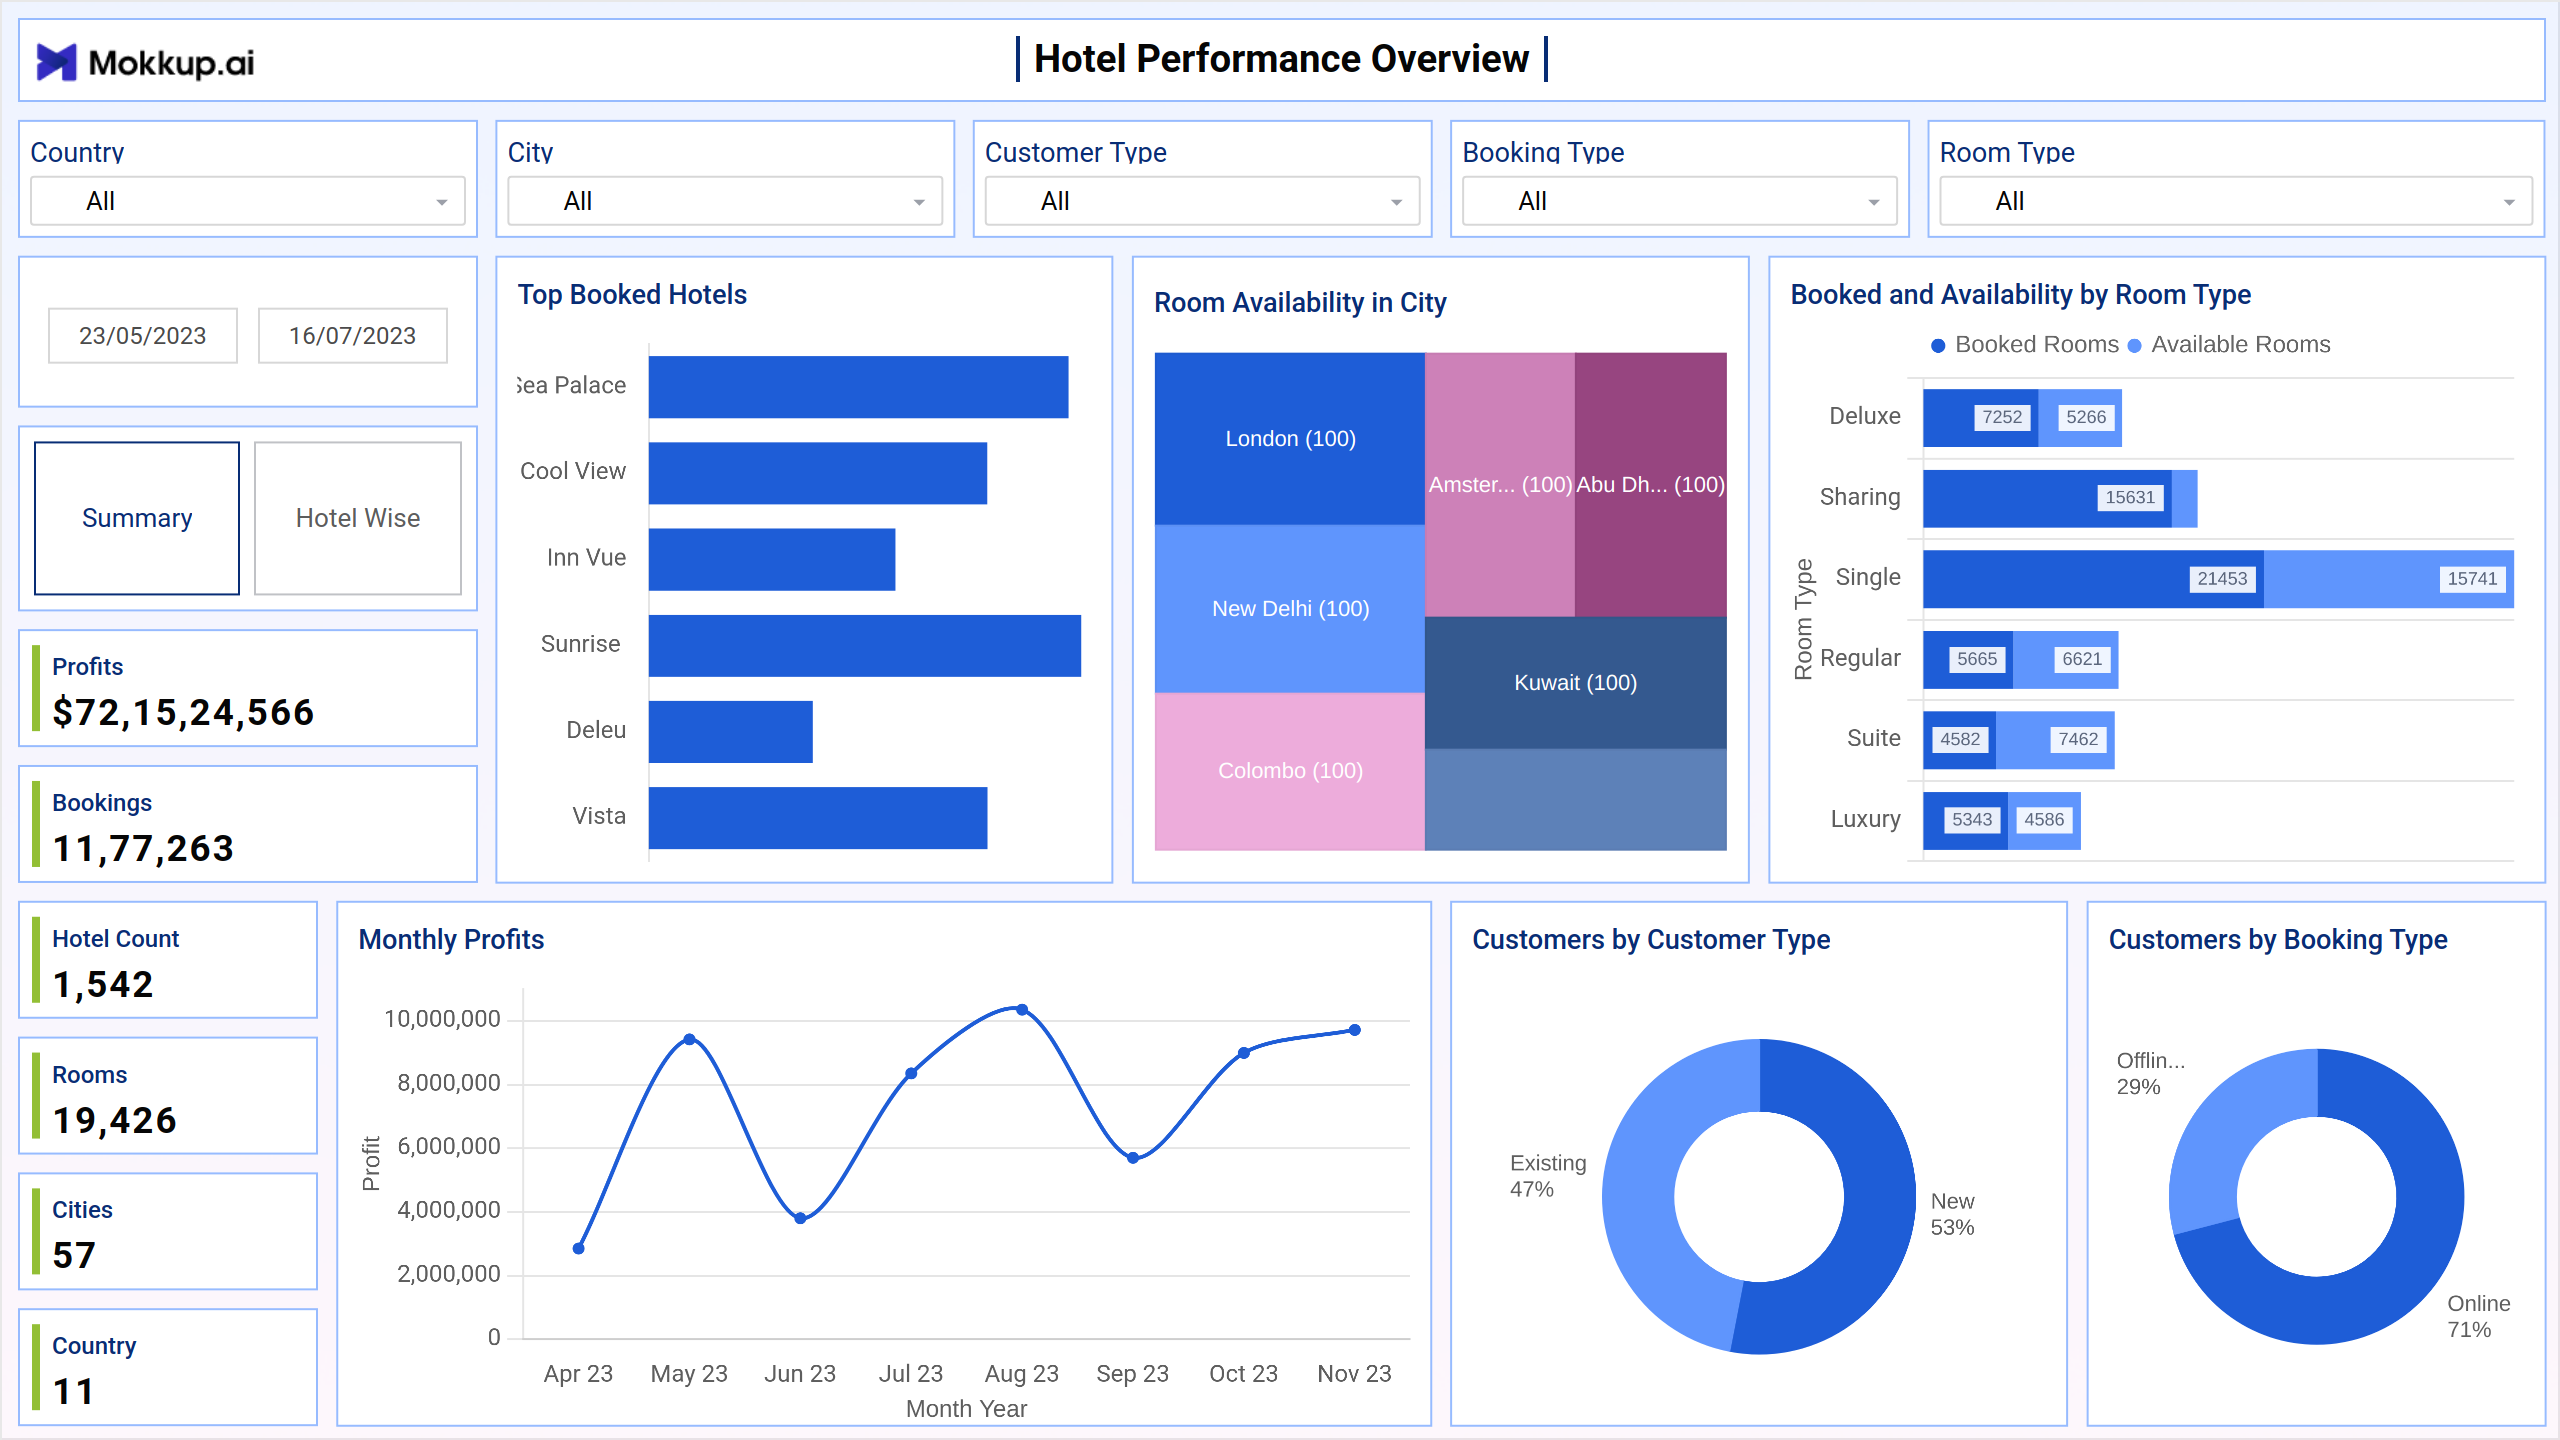
The hotel performance overview dashboard provides an overview of the performance of a hotel or a group of hotels. It collects data from different sources, such as management companies, revenue management systems, and point-of-sale systems, and presents it in an easy-to-understand graphical format. This dashboard template provides hoteliers with a comprehensive tool to track and analyze key performance metrics. By using this, hotel managers can make informed decisions to optimize operations and enhance guest experiences.
Key Terms to Know
- Filters: The filters provide specific details on your dashboard. It allows ending users to control the dashboard view to gain valuable insights. The following filters represent the data accordingly.
- KPIs: The key performance indicators (KPIs) reflect the different values for the targets achieved by the hotel. These values are tracked to evaluate performance in other areas.
- Treemap: The treemap represents the availability of rooms in different cities. A treemap is used to visually display the hierarchical data in nested rectangles representing the branches of a tree diagram.
- Funnel Chart: The funnel chart represents the "Top Booked Hotels" based on the highest to lowest booking rates. A funnel chart takes the highest values at the broader opening on the top and narrows down at the bottom as the value decreases.
- Bar Chart: The bar chart represents the different categories of booked rooms available for booking. The darker shade indicates the value of the booked rooms, whereas the lighter shade indicates the public spaces.
- Line Chart: The line chart represents the profit earned during monthly periods. The line charts display the data over time to track specific trends, etc. If the line height rises from the left to the right, it indicates an increasing trend and vice versa.
Dashboard Template Insights
Hotel managers can make data-driven decisions to improve the performance of their hotels by using this dashboard wireframe. Some of the key takeaways are:
- Assist in making informed decisions about the operations by providing information about KPIs such as bookings, availability of the rooms, profit earned, and more.
- Identifying trends, making data-driven decisions, and optimizing operations to maximize revenue and guest satisfaction.
- Using guest information to know what they like, anticipate their needs, and offer personalized services to make them happier and more loyal.
Conclusion
Several conclusions can be drawn from the hotel management analytics dashboard: optimize occupancy and revenue, personalize guest experiences, boost operational efficiency, and unlock actionable insights for strategic decision-making. With this data-driven approach, you can create a thriving hotel environment that maximizes profitability, guest satisfaction, and long-term success.