
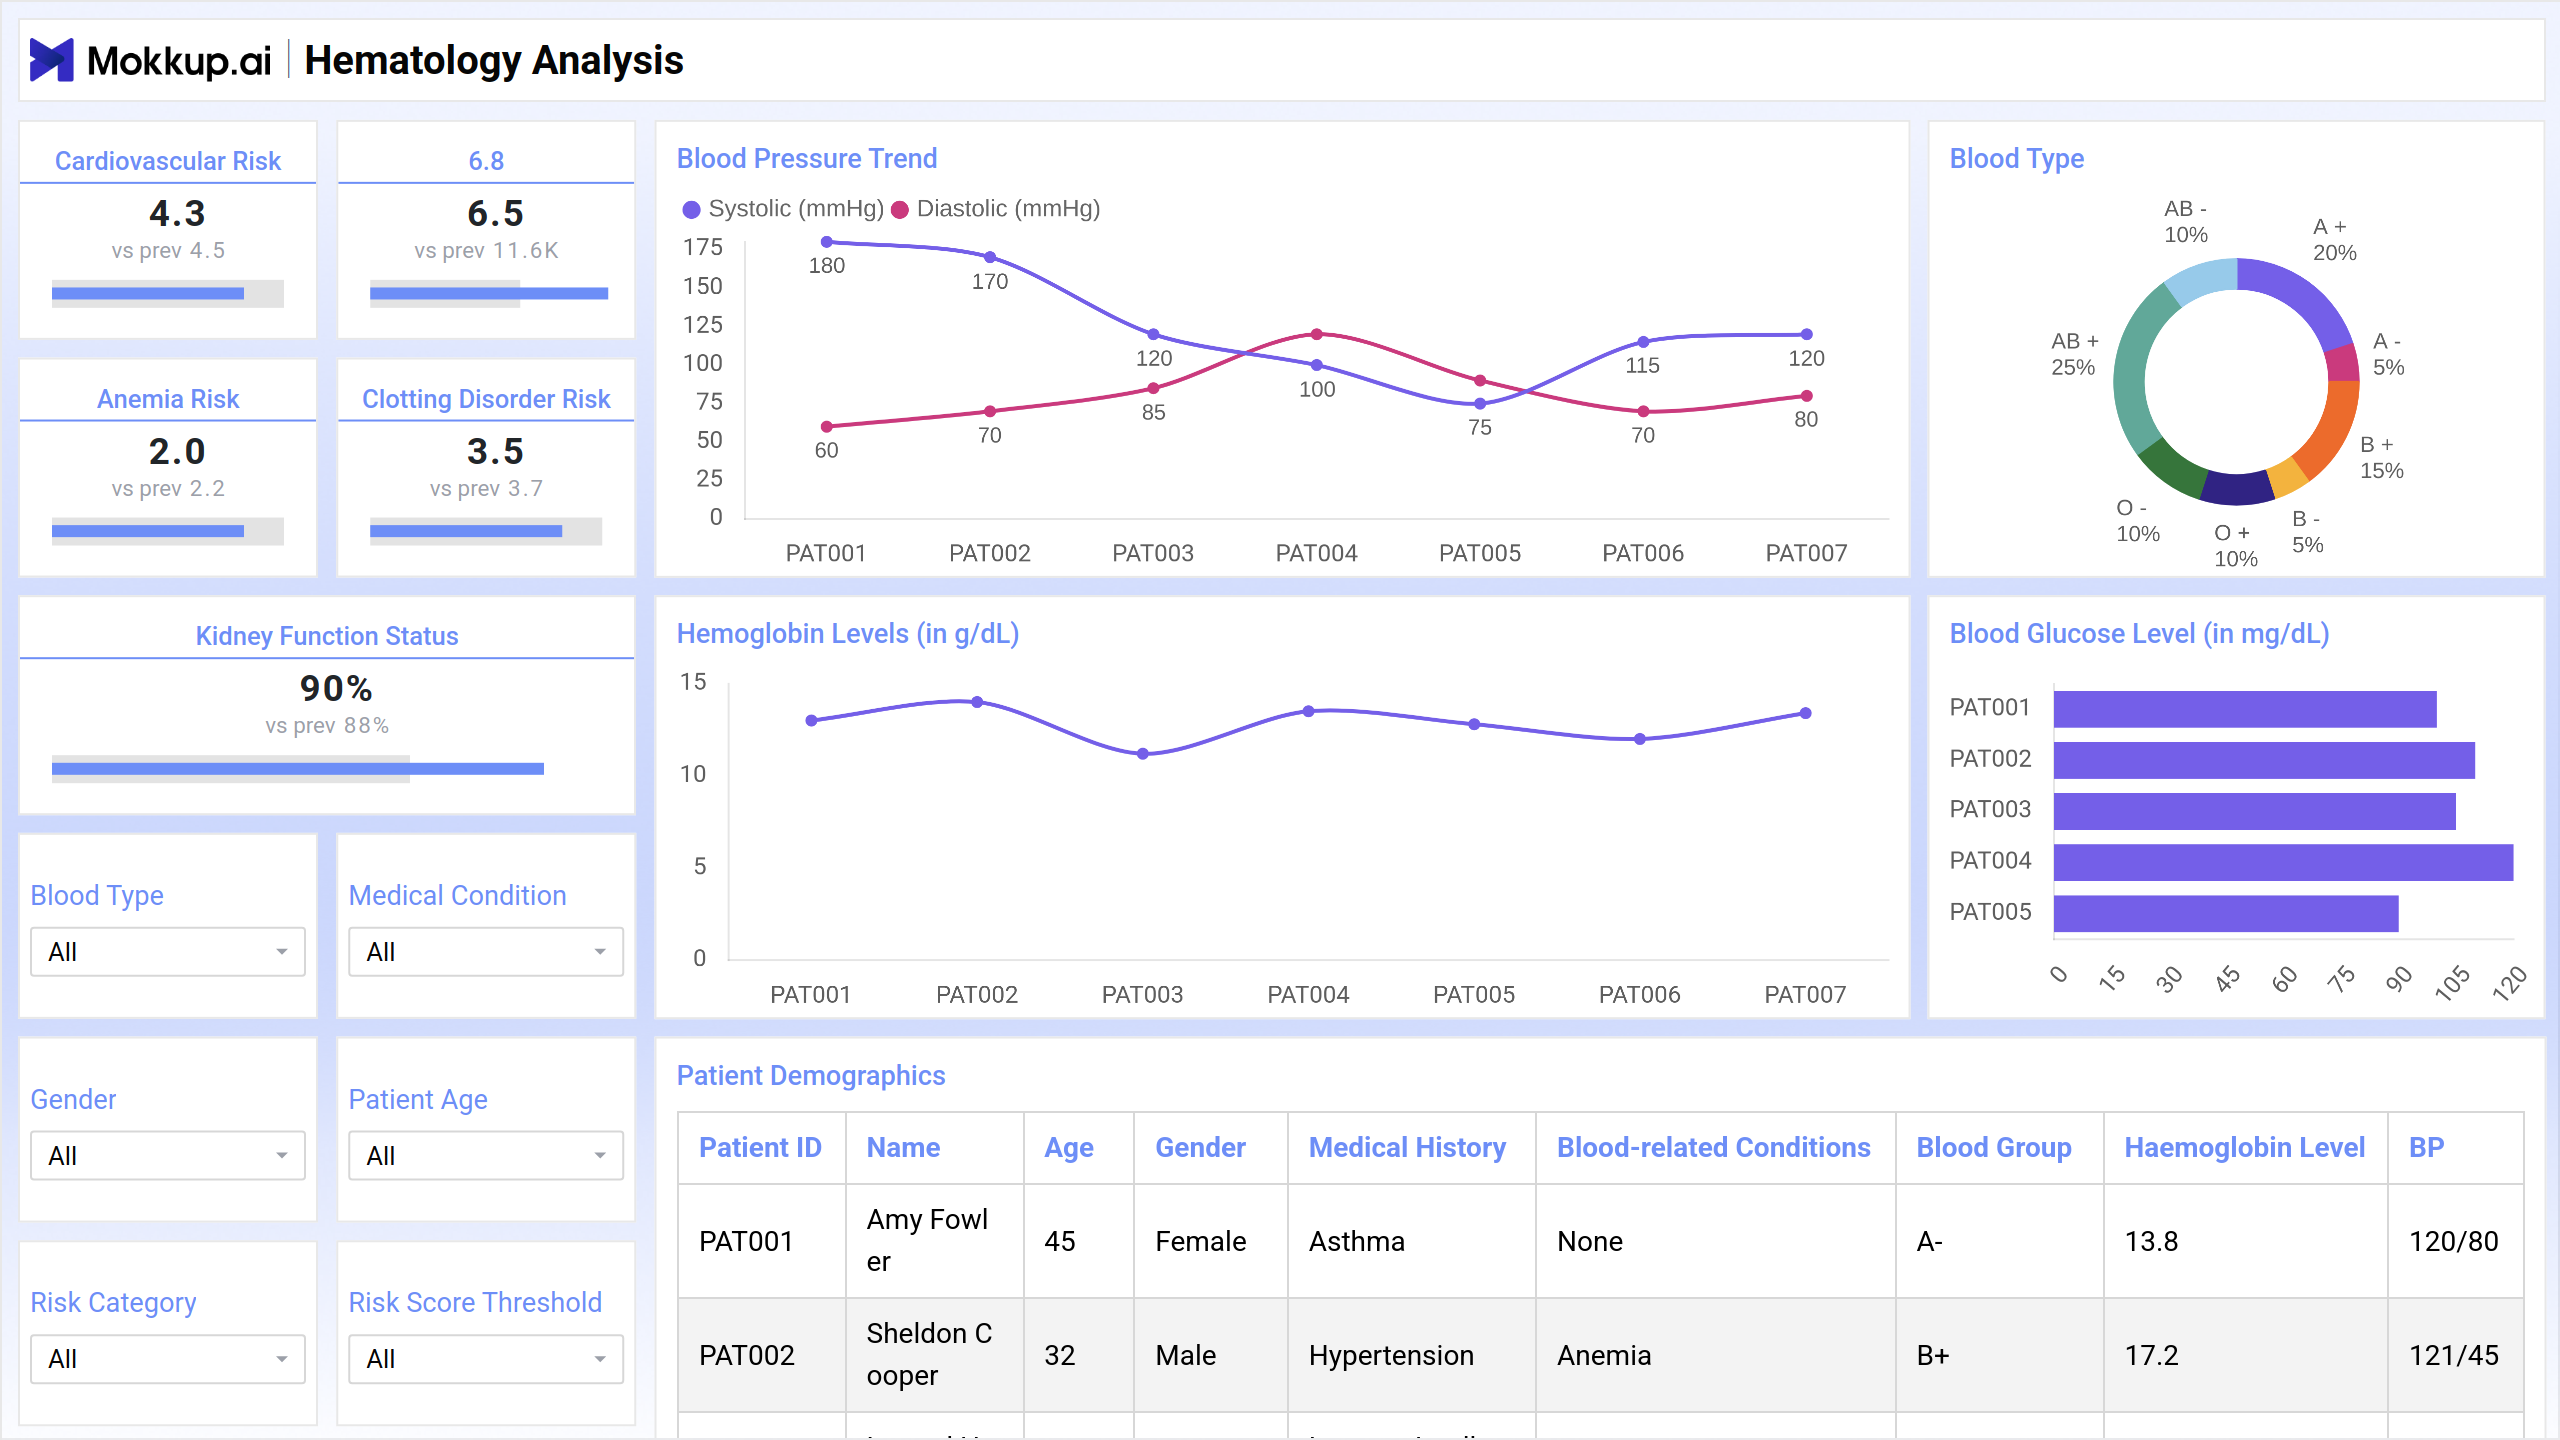
The Hematology Analysis Dashboard template offers healthcare professionals a comprehensive overview of key hematological indicators for patient monitoring and analysis. Through essential KPIs, trend visualizations, and patient demographics, this dashboard enables efficient tracking of cardiovascular risk, anemia risk, clotting disorder risk, kidney function status, blood pressure trends, hemoglobin levels, and blood glucose levels. By providing valuable insights into patients' hematological profiles, this dashboard supports informed decision-making and personalized patient care.
Key Terms to Know
- Cardiovascular Risk: Indicates the risk of cardiovascular diseases based on relevant parameters.
- Anemia Risk: Assesses the likelihood of anemia based on hemoglobin levels and other factors.
- Clotting Disorder Risk: Measures the risk of clotting disorders, providing insights into thrombosis and related conditions.
- Kidney Function Status: Evaluates kidney function through relevant biomarkers, aiding in the management of renal health.
- Blood Pressure Trend: Displays trends in systolic and diastolic blood pressure over time. Allows for the monitoring of blood pressure fluctuations and the assessment of hypertension management.
- Hemoglobin Levels: Visualizes hemoglobin levels over a specified period. Helps in monitoring anemia, assessing response to treatment, and managing blood disorders.
- Blood Glucose Level: Illustrates blood glucose levels, crucial for managing diabetes and related conditions. Facilitates the monitoring of glycemic control and the adjustment of treatment plans.
- Patient Demographics: Provides detailed patient information, including medical history, blood-related conditions, and hemoglobin levels. It offers a comprehensive overview of patient profiles for personalized care and treatment planning.
- Blood Type Distribution: Visualizes the distribution of blood types among patients. It helps in assessing blood compatibility for transfusions and other medical interventions.
Blood Test Results
Screen 2 of the Hematology Analysis Dashboard wireframe delves deeper into the diagnostic aspects of patient hematology, presenting detailed analyses of various blood tests. This screen provides visualizations for blood gas analysis, complete blood count, coagulation profile, lipid profile, and blood chemistry panel, allowing healthcare professionals to comprehensively monitor and interpret key blood parameters.
Key Terms to Know
- Blood Gas Analysis: Displays the results of blood gas analysis, including oxygen and carbon dioxide levels, pH, and bicarbonate levels. It helps assess respiratory function and metabolic status, crucial for diagnosing and managing respiratory and metabolic disorders.
- Complete Blood Count: Visualizes various components of the complete blood count, such as white blood cells, red blood cells, hemoglobin, hematocrit, and platelets. It provides a comprehensive view of a patient’s overall hematological health, aiding in the diagnosis of conditions like anemia, infection, and hematologic diseases.
- Coagulation Profile: Illustrates coagulation parameters such as Prothrombin Time (PT), Activated Partial Thromboplastin Time (aPTT), and International Normalized Ratio (INR).
- Lipid Profile: Shows levels of different lipids including total cholesterol, LDL, HDL, and triglycerides. Crucial for assessing cardiovascular risk and guiding treatment for lipid disorders and cardiovascular diseases.
- Blood Chemistry Panel: Displays trends in various blood chemistry parameters.
Dashboard Template Insights
The dashboard wireframe provides a comprehensive view of key hematological and cardiovascular health indicators, enabling thorough monitoring of patient conditions.
- The KPIs offer critical insights for proactive risk assessment and management.
- Tracking of the vital parameters facilitates early detection of health issues.
- By identifying high-risk patients and areas needing intervention, healthcare providers can allocate resources more efficiently, improving patient outcomes.
Conclusion
The Hematology Analysis Dashboard template provides a detailed and integrated approach to patient monitoring and risk assessment. By providing comprehensive visualizations of key hematological parameters, this dashboard supports accurate diagnosis, effective treatment planning, and proactive patient care. Ultimately, it enhances clinical decision-making and improves health outcomes through detailed insights into patient health and trends in critical blood-related metrics.