The Healthcare Insurance Report provides a detailed overview of group plan metrics, offering insights into plan performance, participation rates, and contributions. Designed to support effective decision-making, this dashboard consolidates key data points, enabling stakeholders to assess and manage group plans efficiently, ensuring alignment with organizational goals and maximizing the benefits for all participants.
The dashboard wireframe comprises four screens: Executive Summary, Enrollment Details, Financials & Medical Claims; each is explained briefly below.
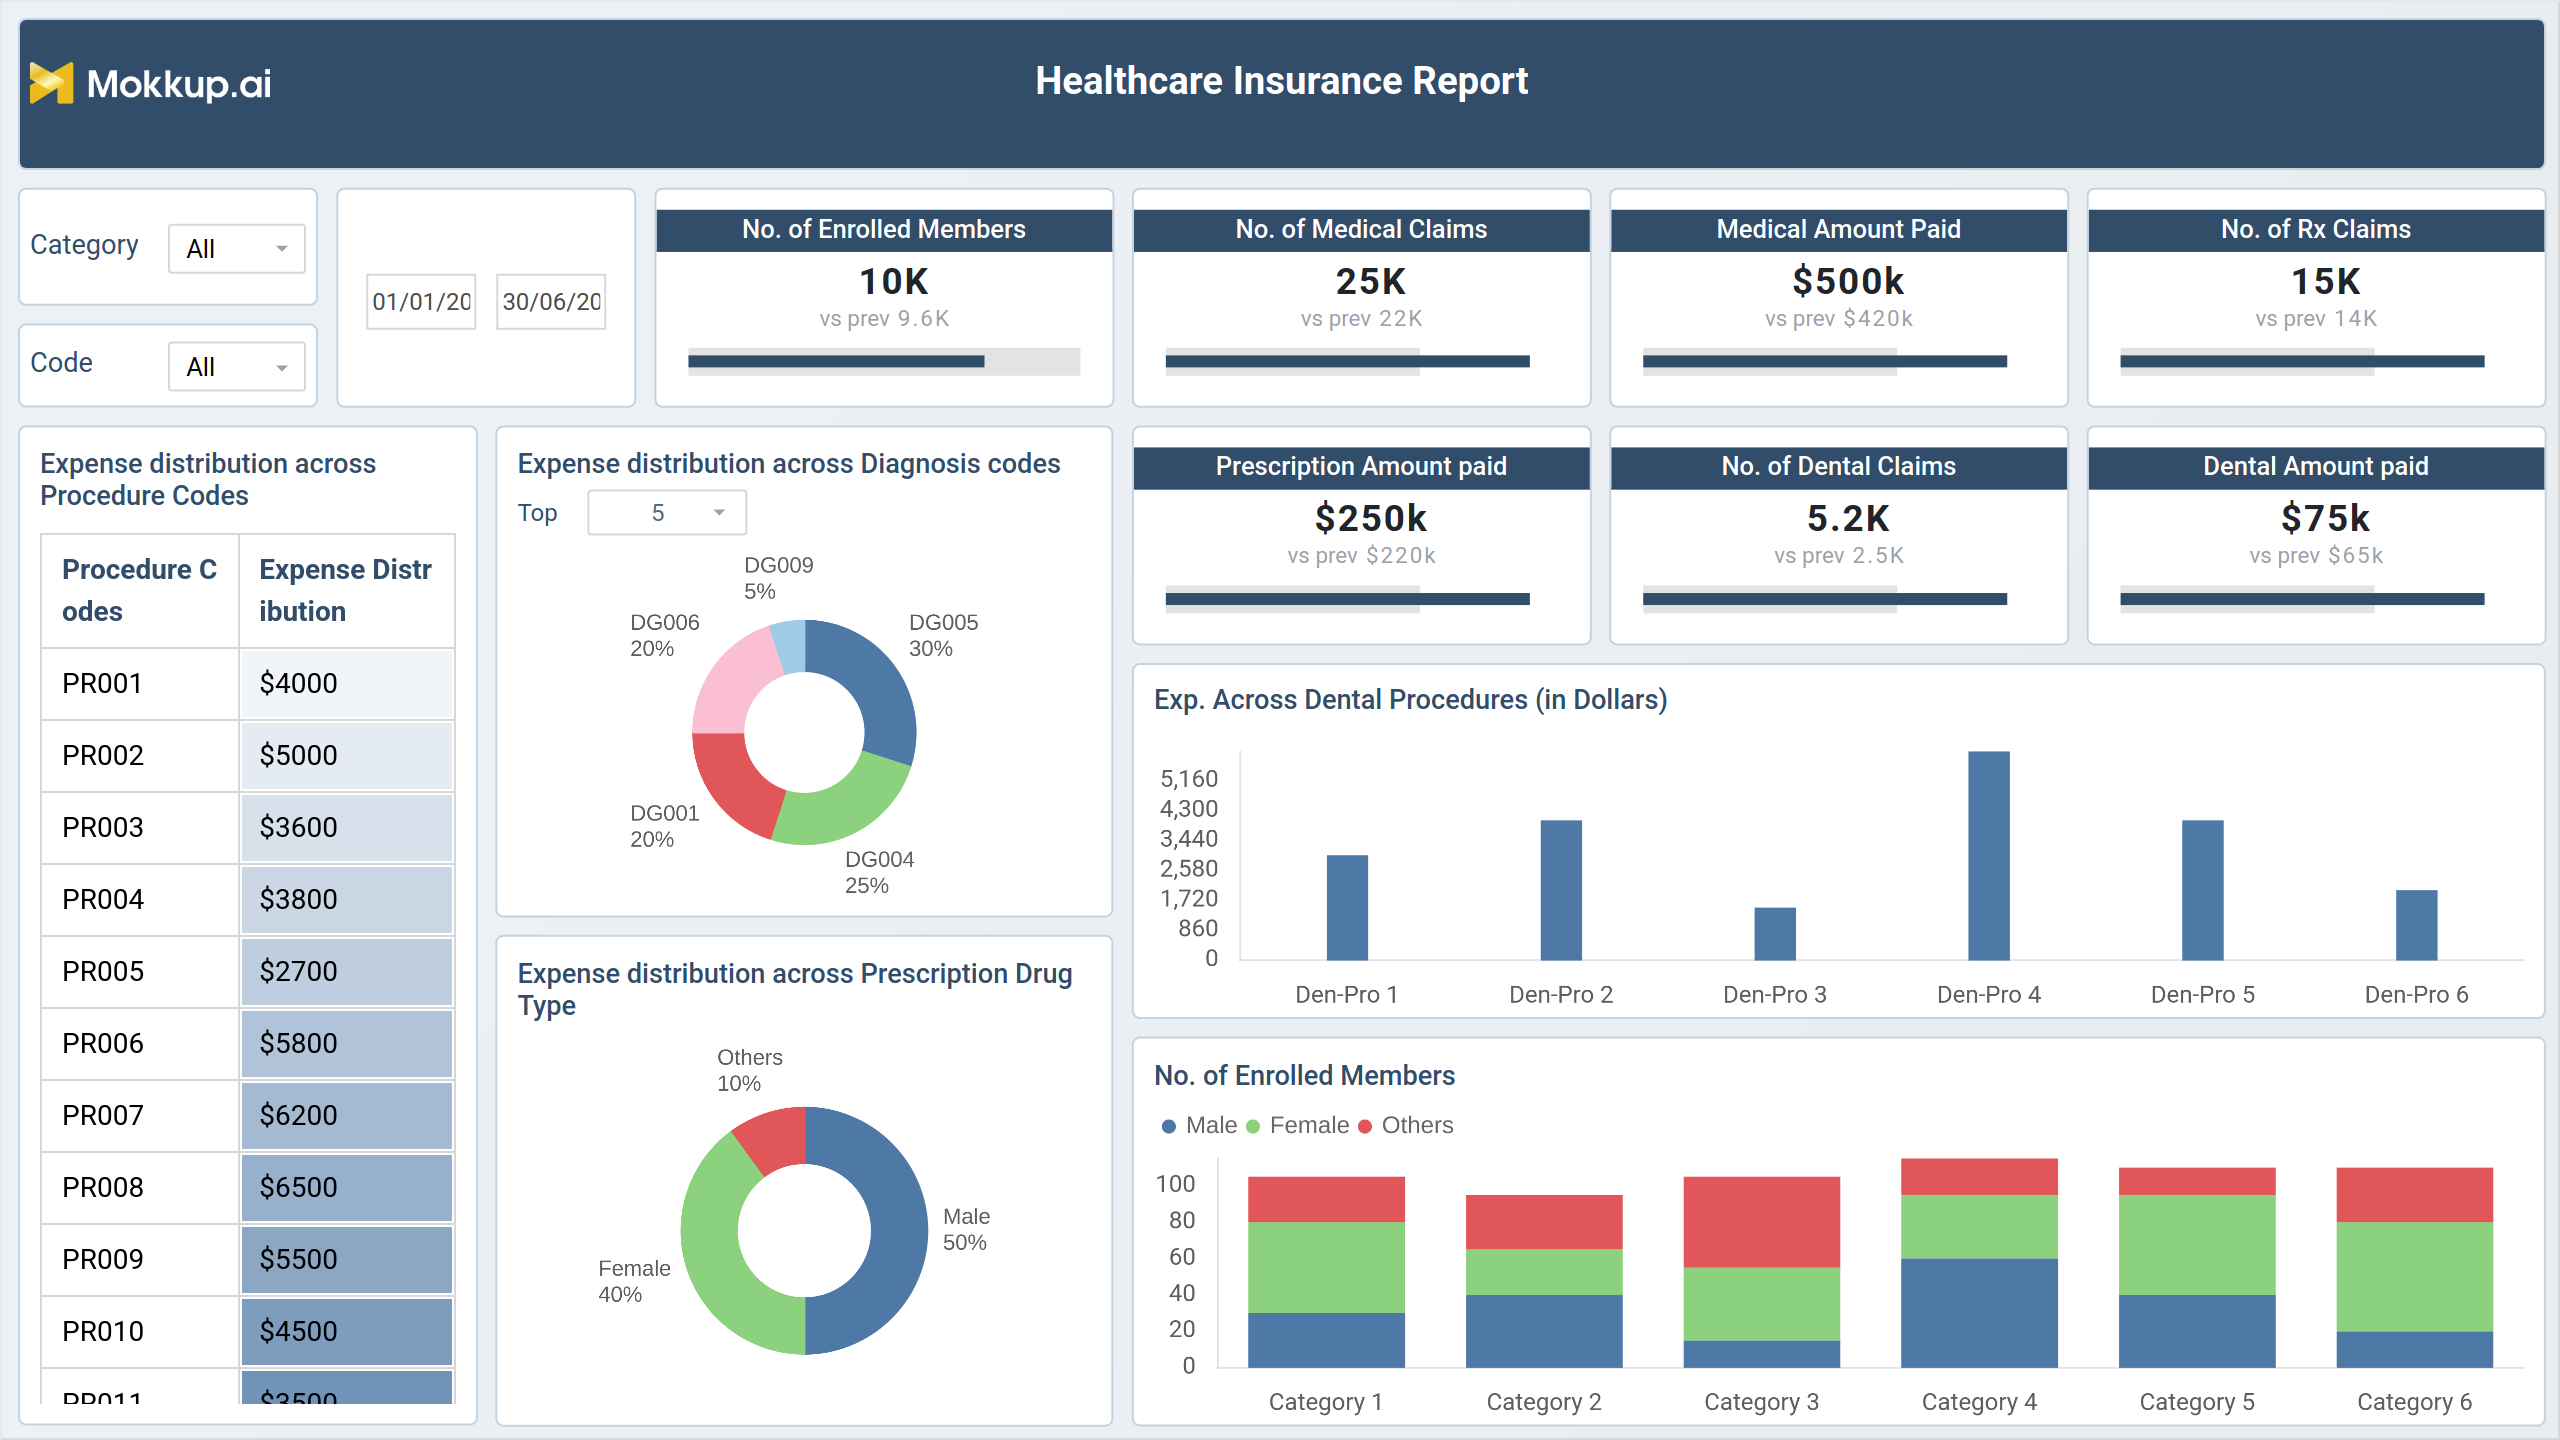
Executive Summary
This screen provides a comprehensive overview of the health plan's performance. It presents key metrics such as the total number of enrolled members, medical and prescription claims, and the amount paid for medical and dental services. It also highlights any significant trends or changes in these metrics compared to previous periods.
Key Terms to Know
- No. of Enrolled Members: Indicates the total number of members enrolled in the group plan.
- No. of Medical Claims: Displays the total number of medical claims submitted.
- Medical Amount Paid: Shows the total amount paid for medical claims.
- Prescription Amount Paid: Displays the total amount paid for prescription claims.
- Expense Distribution Across Diagnosis Codes: Breaks down expenses based on various diagnosis codes.
- Expense Distribution Across Prescription Drug Type: Shows the distribution of expenses by different types of prescription drugs.
- Expense Distribution Across Dental Procedures (in Dollars): Indicates the amount spent on various dental procedures.
Enrollment Details
This view provides a comprehensive overview of the plan's enrollment metrics. It includes information on the number of enrolled members, employees enrolled, average member age, and premium paid. It also visualizes enrollment trends over time and breaks down enrollment by county of residence, plan category, and coverage start year.
Key Terms to Know
- Plan Satisfaction Score: Measures the overall satisfaction level of members with the group plan.
- Premium Paid: Displays the total premiums paid by members for the group plan.
- Average Member Age: Shows the average age of enrolled members.
- Enrollment Growth Rate: Indicates the rate at which enrollment in the plan is increasing over time.
- Enrollment by Country of Residence: Breaks down the number of enrolled members by their country of residence.
- Enrollment by Plan: Displays the distribution of members across different plans offered.
- Enrollment by Coverage Start Year: Shows the number of enrollments based on the year coverage started.
Financials
This section includes information on the total billed amount, total paid amount, cost savings, and claim approval rate. It also visualizes financial trends over time and breaks down the cost distribution by copay, deductible, and coinsurance. By providing detailed financial data, this section enables stakeholders to understand the plan's financial health and identify areas for cost savings or revenue generation.
Key Terms to Know
- Plan Payment Amounts: Displays the total amounts paid out under the group plan.
- Total Billed Amount: Shows the total amount billed to the plan for claims.
- Total Payment Amount: Indicates the total amount paid by the plan for approved claims.
- Claim Approval Rate: Measures the percentage of claims that are approved.
- Cost Distribution: Breaks down the distribution of costs across different categories.
- Cost Savings: Indicates the amount of money saved through cost management strategies.
Medical Claims
This section includes information on the total number of medical claims, average claim cost, claim denial rate, and the top medical procedures and diagnoses. It also visualizes claim trends over time and breaks down claims by provider, member, and diagnosis. By providing detailed medical claims data, this section enables stakeholders to understand the plan's utilization patterns, identify areas for cost savings, and assess the quality of care provided.
Key Terms to Know
- No. of Medical Claims: Displays the total number of medical claims submitted under the plan.
- Total Payment Amount: Indicates the total amount paid out for approved claims.
- Total Billed Amount: Shows the total amount billed to the plan for all claims.
- Plan Payment Amounts: Reflects the specific amounts paid by the plan for various claims.
Dashboard Template Insights
Here are four key achievements of this dashboard wireframe:
- Offers a clear summary of enrollment, claims, and payments, providing a holistic view of group plan performance.
- Breaks down costs by diagnosis codes, prescription types, and dental procedures, aiding in precise financial management.
- Highlights key metrics like claim approval rates and cost savings, supporting informed decision-making.
- Presents data on member age, satisfaction, and enrollment trends, enabling targeted plan adjustments.
Conclusion
In conclusion, this wireframe comprehensively summarizes essential group plan metrics. Consolidating data on performance, participation, and contributions enables stakeholders to make informed decisions. This dashboard supports efficient plan management, helping to align group plans with organizational objectives and ensuring they deliver maximum value to participants.