
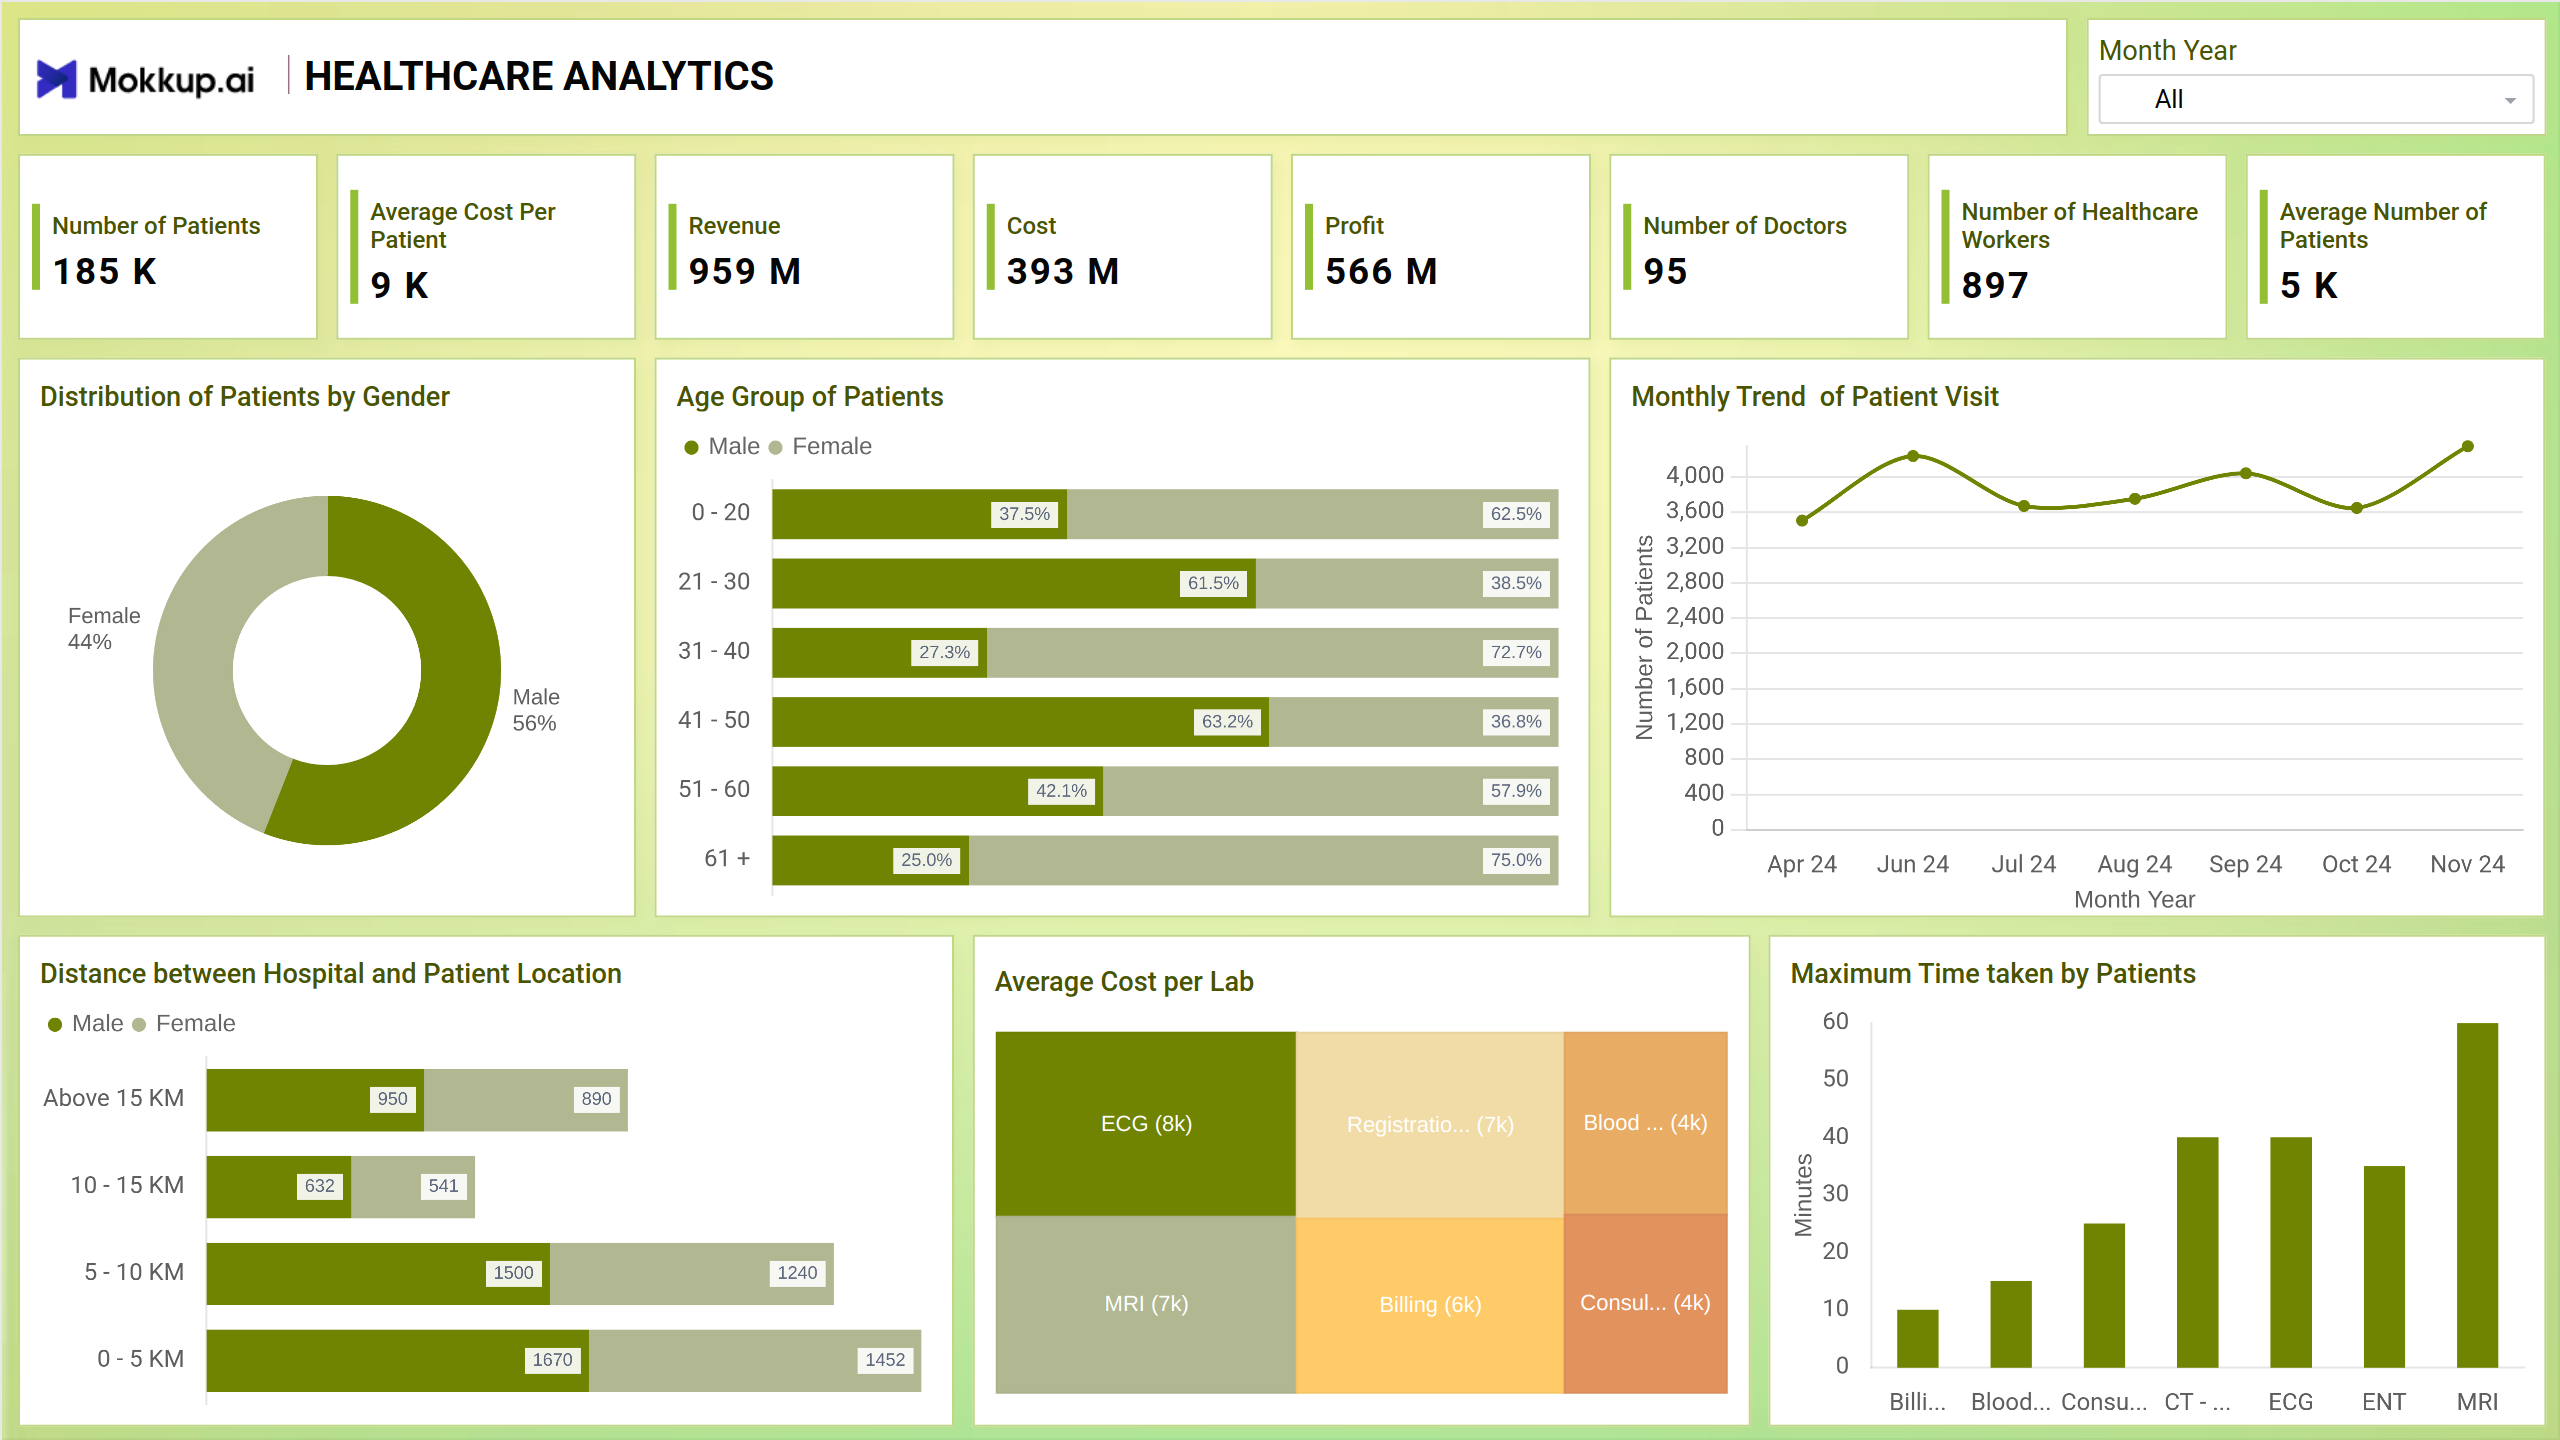
A healthcare analytics dashboard template helps healthcare professionals monitor, analyze, and visualize data on numerous areas of healthcare, such as patient outcomes, financial performance, clinical processes, and operational efficiency. It provides a consolidated and interactive platform for viewing and tracking key performance indicators (KPIs), metrics, and trends. The dashboard presents the data in charts and graphs and includes drill-down functionality to enable users to analyze and explore data more granularly. A healthcare analytics dashboard displays patient data in various ways. By visualizing key metrics such as patient demographics, treatment outcomes, and resource utilization, healthcare professionals can make data-driven decisions to improve clinical outcomes and streamline processes.
Key Terms to Know
- Filter: The filters allow the users to target a specific view. The "month year" filter displays the data on the dashboard based on the previous data records.
- KPIs: The key performance indicators (KPIs) give an overview of the total number of patients, the cost, and the average values.
- Donut Chart: The donut chart depicts the gender distribution of patients at the healthcare center.
- Bar Graph: The bar graph depicts the age group of the patients and the number of patients that fall under the specific age group.
- Line Chart: The line chart depicts the total number of patients who scheduled a visit to the health care center over a specified period.
- Treemap: The treemap represents the average cost of the facilities provided by the healthcare center.
- Column Chart: The column chart shows how much time each patient spent through the various diagnostic procedures.
Dashboard Template Insights
This dashboard template aims to give actionable insights and allow data-driven decision-making. It can assist in the following goals:
- Track and analyze treatment effectiveness, identify high-risk patients, and develop personalized care plans for better health trajectories.
- Monitor resource allocation, staff performance, and wait times to streamline operations and optimize clinic flow.
- Gain insights into disease prevalence, treatment trends, and patient demographics to inform evidence-based decision-making.
Conclusion
A healthcare analytics dashboard can provide valuable information and conclusions, such as identifying trends, patterns, and areas for improvement and tracking progress over time.