
What is a Gastroenterology Hospital Clinical Dashboard?
A Gastroenterology Hospital Clinical Dashboard is a healthcare performance tool that tracks patient volumes, disease prevalence, surgical outcomes, and operating theater utilization in gastroenterology departments. By consolidating patient demographics, procedure trends, and surgeon performance metrics, it provides hospitals with real-time insights into efficiency and quality of care.
The gastroenterology hospital clinical dashboard template integrates clinical and operational data, helping administrators monitor key indicators like surgical volume, complication rates, and recovery times. As a real-time gastroenterology performance monitoring dashboard, it supports data-driven decision-making to improve patient care, optimize resources, and enhance overall clinical efficiency.
How To Create a Gastroenterology Hospital Clinical Dashboard
You don’t need to build your report from scratch—just start with a ready-to-use sample Gastroenterology Hospital Clinical Dashboard template from Mokkup. Add your data and export it as needed. Here’s how to do it:
1. Create or Log in to Your Mokkup Account
Start by signing up on Mokkup.ai using your email. If you already have an account, just log in, and you’ll be good to go.
2. Choose and Customize Your Dashboard Template
You can find the Gastroenterology Hospital Clinical Dashboard template in the Templates section. Use the drag-and-drop editor to adjust KPIs, edit filters, or add elements based on your data.
3. Export to Your BI Tool
Once your dashboard wireframe is ready, use the BI Tool Export feature to send it directly to Power BI or Tableau for further analysis and enhancements. You can also download the dashboard as a PDF, PNG, or JPEG, embed it on a platform, or invite your team to collaborate.
Note: This is a Pro template. You’ll need a Pro subscription on Mokkup to use and customize this dashboard wireframe. Upgrade anytime to unlock full access.
Gastroenterology Hospital Clinical Dashboard Example
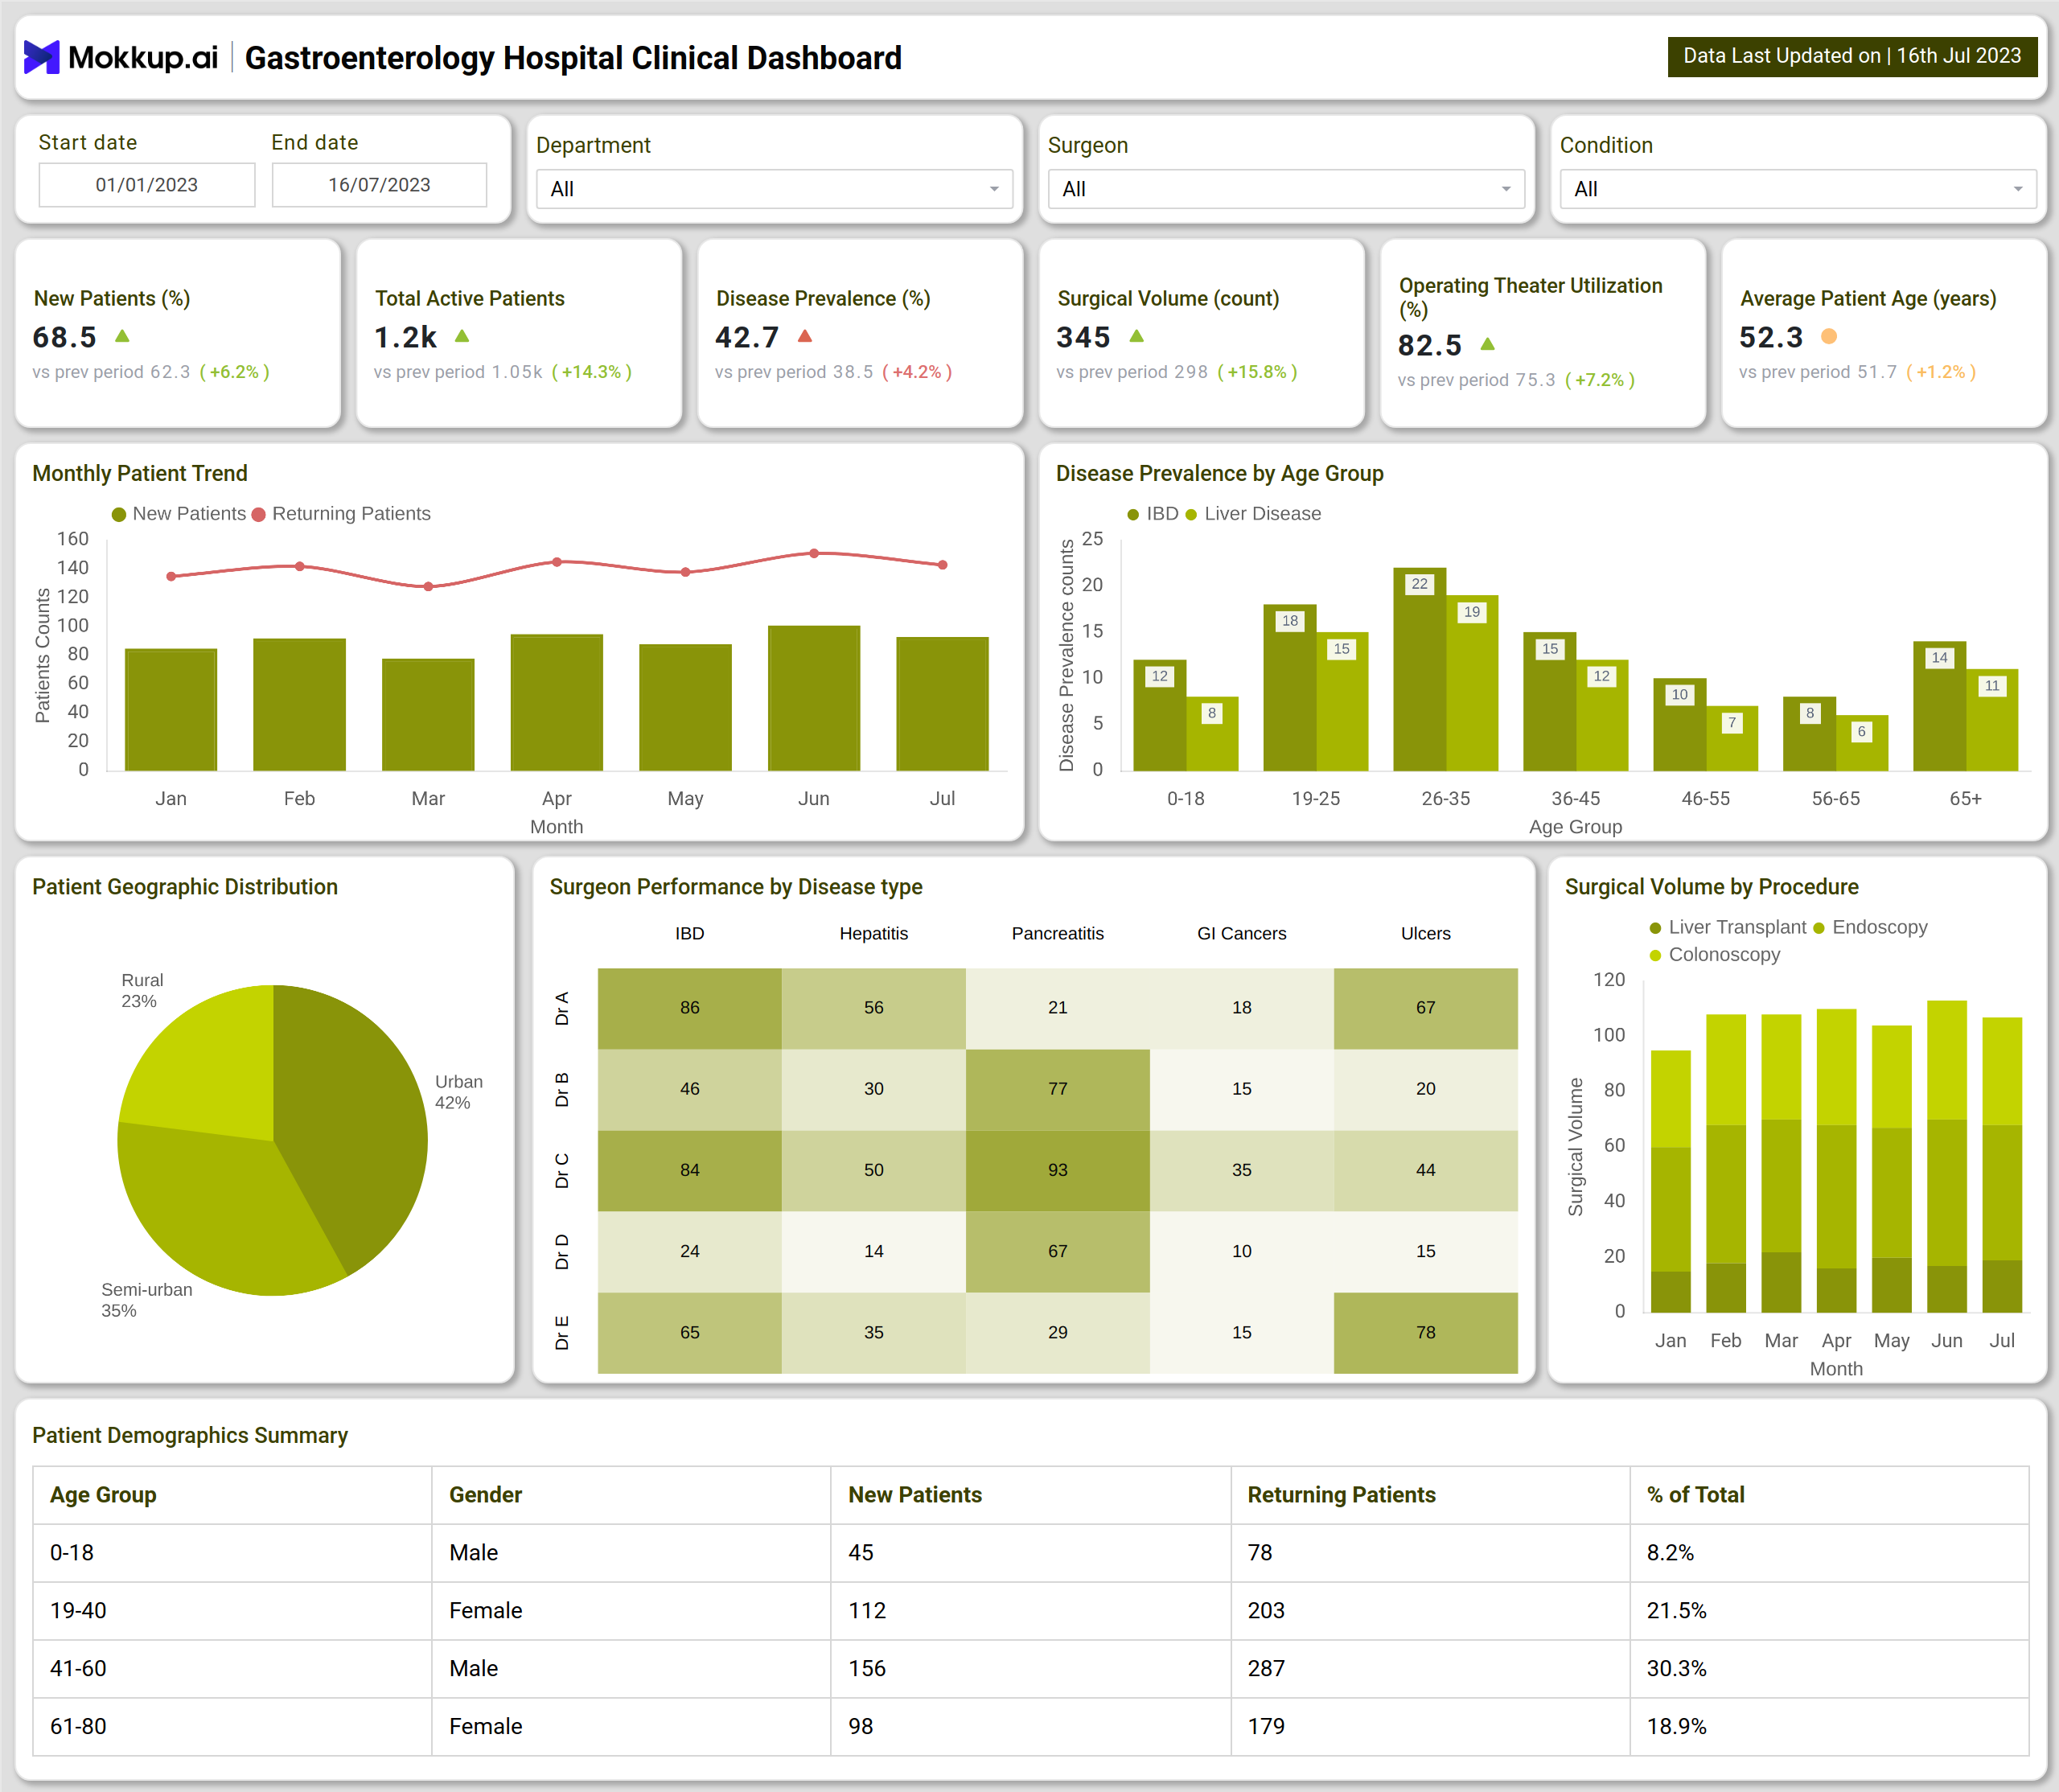
The example dashboard offers a comprehensive view of gastroenterology performance through multiple KPIs and visuals. It highlights new patients, total active patients, disease prevalence, surgical volumes, and operating theater utilization. Patient-level insights are further enhanced with demographic breakdowns by age and gender, along with geographic distribution of rural, semi-urban, and urban patients. Disease prevalence is categorized by age group, covering major conditions such as inflammatory bowel disease (IBD) and liver disease. Surgical volume by procedure tracks endoscopy, colonoscopy, and liver transplants, showing growth and utilization trends.
The surgeon performance matrix provides insights into surgical counts, complication rates, satisfaction scores, recovery times, and readmission rates. This ensures accountability at the surgeon level while also tracking institutional efficiency. Together, the dashboard serves as a clinical and operational tracking dashboard, providing a unified view of gastroenterology hospital performance.
How to Analyze Data in Gastroenterology Hospital Clinical Dashboards
- Monitor Patient Trends – Compare new vs. returning patient flows to assess growth.
- Track Disease Prevalence – Use age-based distribution to forecast care needs for IBD, liver disease, and other conditions.
- Evaluate Surgeon Performance – Identify strengths and improvement areas across complication rates, satisfaction, and readmission.
- Assess Surgical Volume – Measure procedure utilization to optimize operating theater resources.
- Review Patient Demographics – Understand patient distribution across age, gender, and geography for better planning.
Benefits of Gastroenterology Hospital Clinical Dashboards
- Enhanced Operational Efficiency – Monitors theater utilization and procedure trends.
- Improved Clinical Quality – The gastroenterology hospital clinical dashboard template links surgical performance with patient outcomes.
- Data-Driven Decision Making – Supports administrators in resource allocation and care delivery planning.
- Patient-Centered Insights – Demographics and disease prevalence highlight care needs across populations.
- Accountability and Transparency – Real-time gastroenterology performance monitoring dashboard provides visibility into surgeon performance.
KPIs to Track in Gastroenterology Hospital Clinical Dashboards
- New vs Returning Patients (%) – Measures patient inflow trends and loyalty.
- Surgical Volume (count) – Tracks the number of procedures performed across gastroenterology.
- Operating Theater Utilization (%) – Evaluates efficiency of surgical resources.
- Disease Prevalence (%) – Identifies common gastroenterological conditions across age groups.
- Surgeon Performance Metrics – Assesses surgery counts, complication rates, and readmission levels.
Frequently Asked Questions
Q1. Why is a Gastroenterology Hospital Clinical Dashboard important?
It provides hospitals with real-time visibility into patient flows, surgical volumes, and disease prevalence, enabling better planning and outcomes.
Q2. Can this dashboard integrate with EMR/EHR systems?
Yes, the gastroenterology hospital clinical dashboard template can integrate with hospital EMR/EHR platforms for seamless data access.
Q3. How does this dashboard improve surgeon accountability?
Tracking complication rates, recovery times, and satisfaction scores helps identify high-performing surgeons and areas for improvement.