
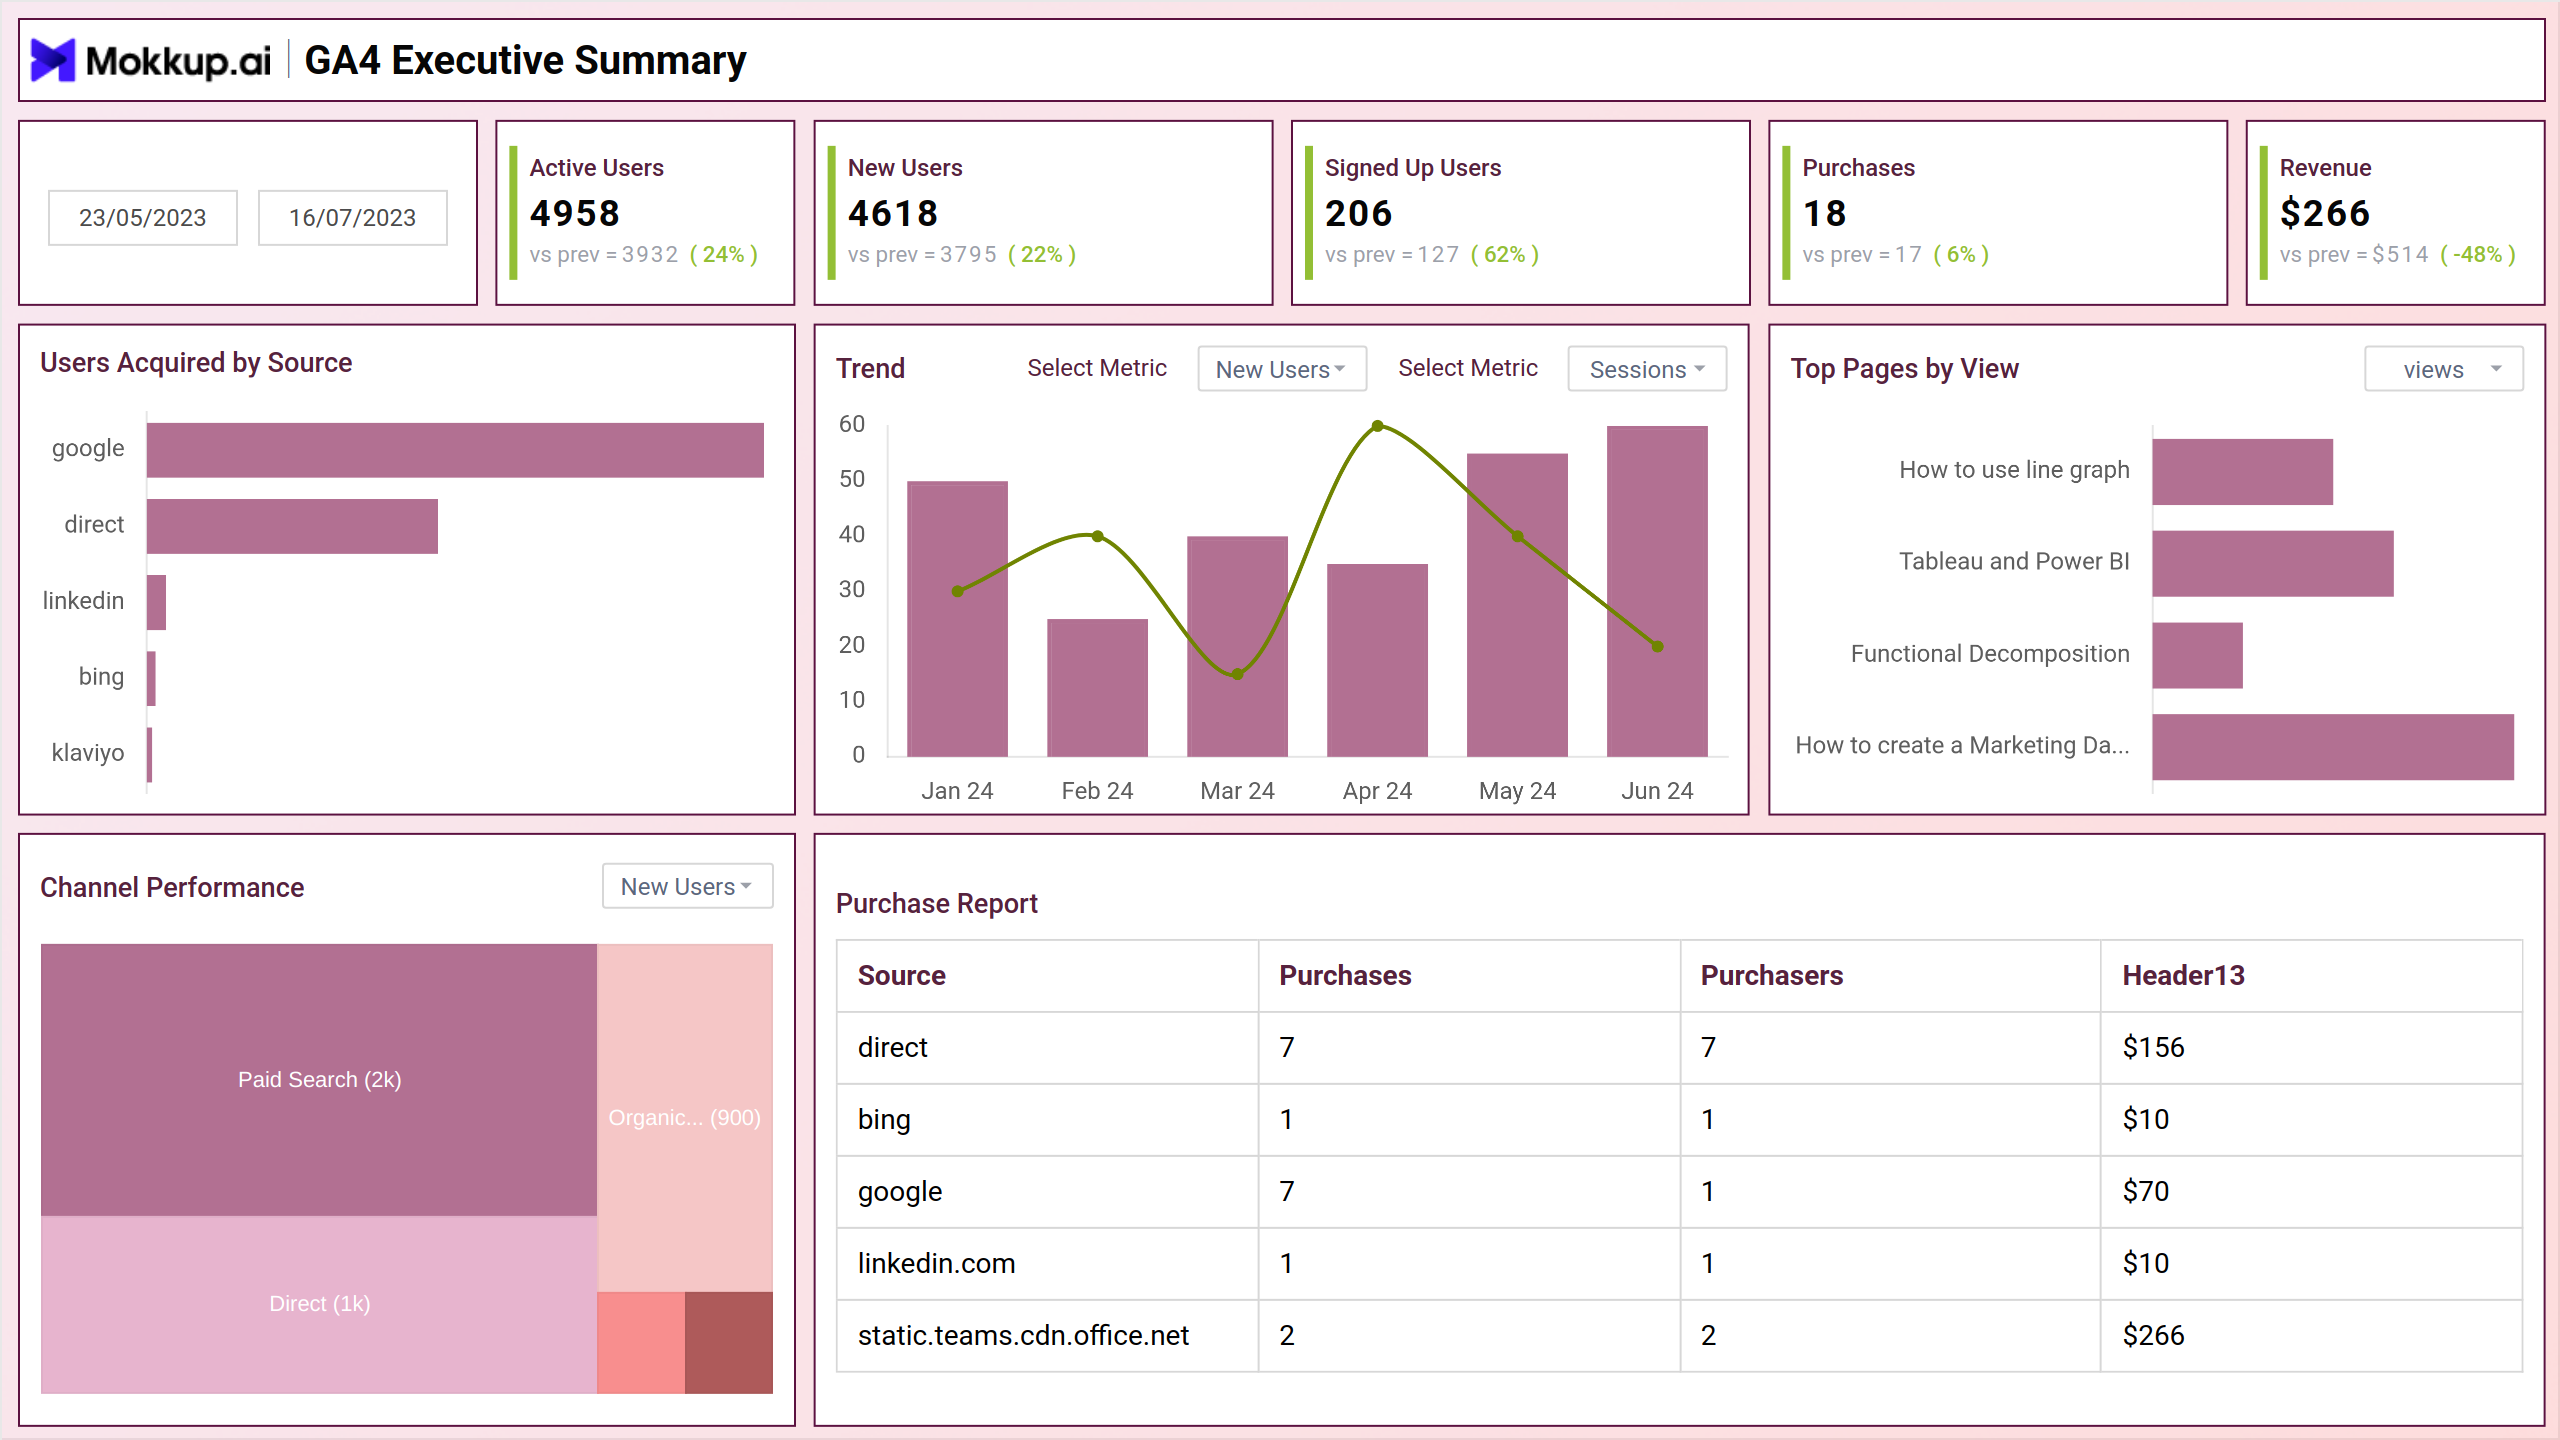
GA4 has added new features for a better user experience, and Mokkup has included the GA4 dashboard in its wireframing solution. You can easily create attractive dashboards using user-friendly tools. One can customize the interface and ready-made KPIs that are available.
Additionally, you can use drag-and-drop options. It allows analytics to be visualized before using Power BI or Tableau and streamlines workflow to enhance products/services.
The dashboard wireframe comprises four screens: GA 4 Executive Summary, GA 4 Organic Vs Paid Users, GA 4 Acquisition & GA4 Conversion Performance; each of them is explained briefly below.
GA4 Executive Summary
This screen features important website traffic performance information like audience maps and user activity. It also shows the audience's age, gender, and where they are from.
Key Terms to Know
- User Acquired By Source: Identify the top sources of new users to your website and track acquisition trends over time.
- Trend: Track trends in key metrics such as users, sessions, page views, and conversions over time.
- Top Pages by View: Identify the most popular pages on your website based on the number of views.
- Channel Performance: Compare the performance of different marketing channels to identify the most effective channels for acquiring and converting customers.
- Purchase Report: Track key purchase metrics such as revenue, conversion rate, and average order value.
GA4 Organic Vs Paid Users
This screen offers a concise comparison between organic and paid traffic sources, providing crucial insights into user acquisition strategies.
Key Terms to Know
- Total Users by Channel: See the overall user acquisition breakdown across organic and paid channels.
- Paid Conversion Rate: Measure the effectiveness of paid campaigns in turning clicks into actions.
- Organic Vs Paid Trend: Track engagement and performance trends for both organic and paid users over time.
- Channel Summary: Highlight key metrics like cost per acquisition and user lifetime value for each channel.
GA4 Acquisition
This screen offers a streamlined overview of user acquisition channels, facilitating a deeper understanding of traffic sources. It also enables swift identification of high-performing channels and informs decision-making to optimize marketing investments for maximum impact.
Key Terms to Know
- Acquisition Summary: Get a quick overview of overall user acquisition performance across all channels.
- New Users Summary: Explore trends and demographics of newly acquired users to understand your audience growth.
- Top Source by Number of Users: Identify the top sources driving the most users to your site or app.
- Top Campaign Name by Number of Users: Identify the top-performing campaign that excels in drawing in new users.
GA4 Conversion Performance
The screen provides a comprehensive overview of conversion metrics, empowering businesses to evaluate the effectiveness of their conversion strategies.
Key Terms to Know
- Total Number of Conversions: Track overall conversion performance by viewing the total number of conversions for the selected period.
- Trend of Event Count: Gain insights into key user engagement through the event occurrences.
- Event Count Distribution: Visualize the distribution of event counts across different user segments to identify conversion hotspots.
- Conversion by Channel: Identify the top conversion channels and delve into their efficiency to optimize your marketing efforts.
Dashboard Template Insights
This dashboard wireframe offers a comprehensive snapshot of website performance, enabling executives to grasp critical insights and make informed decisions swiftly. Below are some key highlights:
- Easily see important numbers like how many people visit your site, how engaged they are, where they come from, and how much money you're making, all in one easy-to-read format.
- Find out more about who your customers are, their interests, and how they behave online so you can make your marketing more personal.
- Use the information you gather about your campaigns, how users move through your site, and what leads them to buy to make better decisions about marketing your products.
Conclusion
A GA4 executive summary is a concise report that provides a high-level overview of your website's performance and key areas of focus. By tracking key metrics such as user acquisition by source, trend, top pages by view, channel performance, and purchase report, you can gain valuable insights into your marketing strategy and identify opportunities for improvement.