
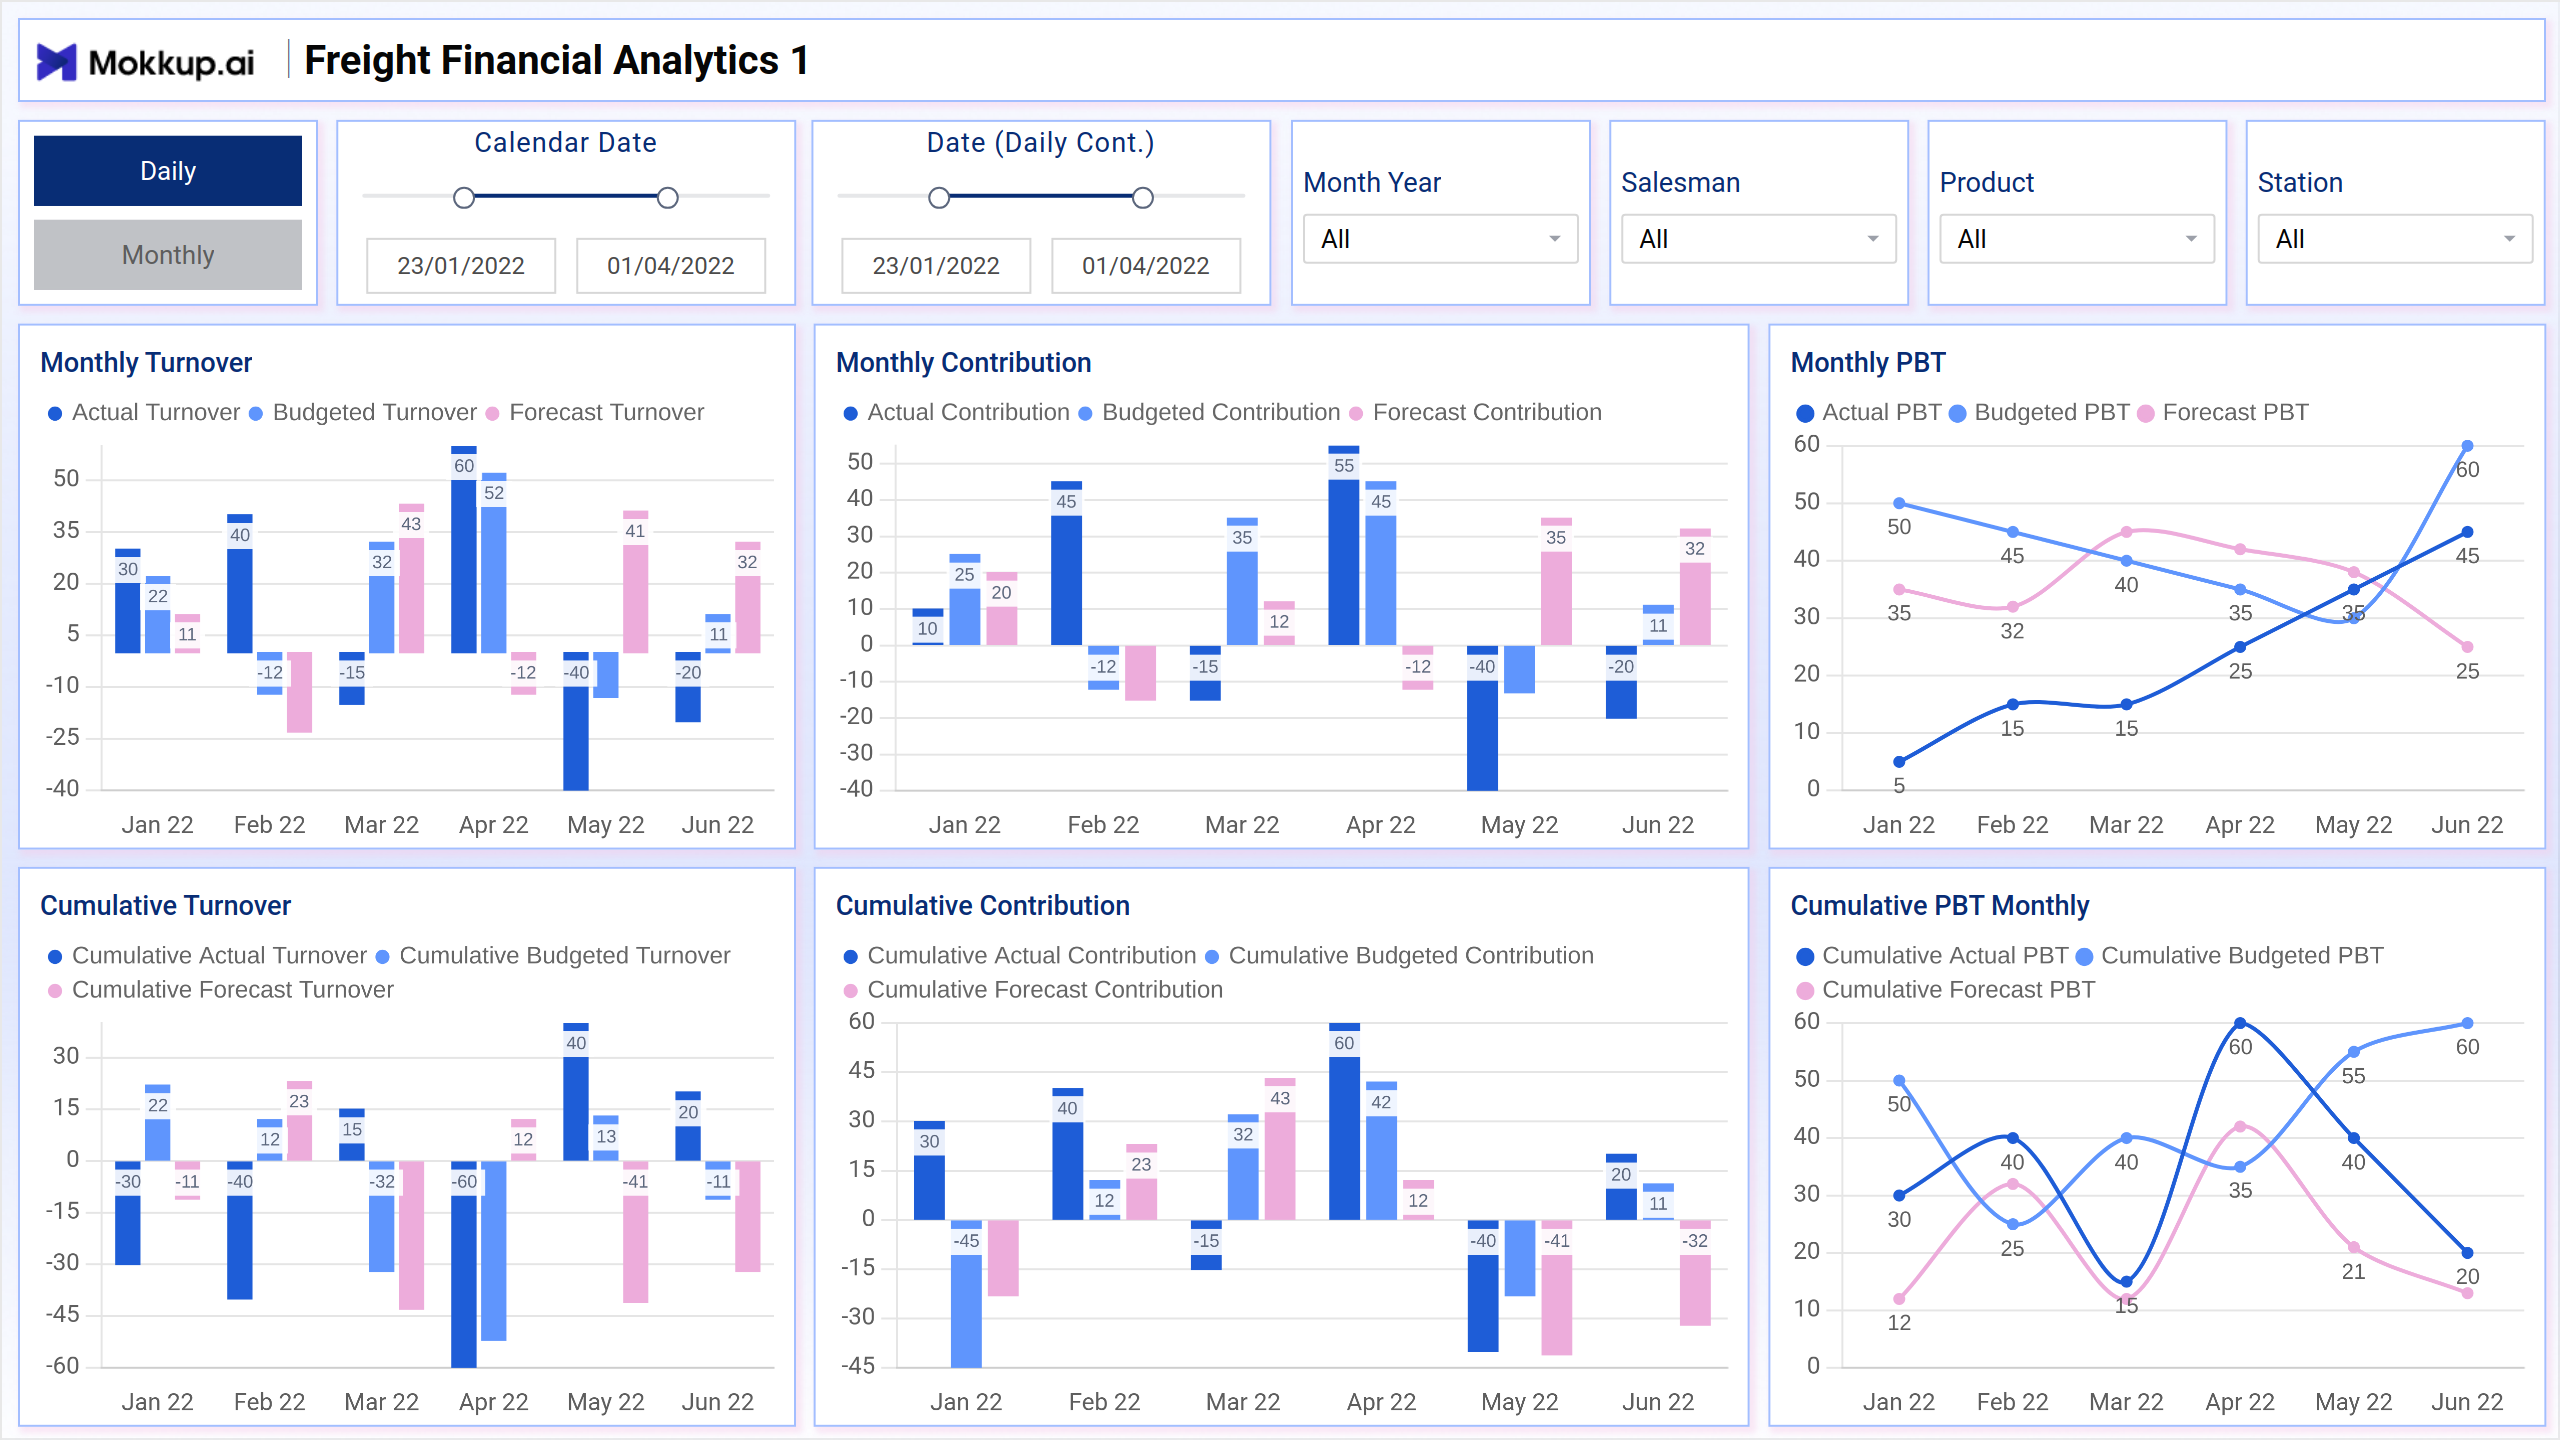
The Freight Financial Analytics dashboard template provides essential insights into key financial metrics such as volume, profit before tax (PBT), and turnover. By analyzing these metrics, organizations can gain a comprehensive understanding of their financial performance, make informed decisions, and drive profitability and growth in the freight industry.
Freight Financial Analytics 1
The Freight Financial Analytics 1 offers a detailed analysis of monthly and cumulative turnover, contribution, and profit before tax (PBT), presenting actual, budgeted, and forecasted values for each metric.
Key Terms to Know
- Monthly and cumulative turnover, contribution, and profit before tax (PBT) are presented with actual, budgeted, and forecasted values.
- The dashboard wireframe provides a detailed analysis of financial performance metrics, offering insights into revenue generation, profitability, and budget adherence.
- By comparing actual performance with budgeted and forecasted values, organizations can identify variances, assess financial health, and make informed decisions.
Freight Financial Analytics 2
Freight Financial Analytics 2 delves into the contributions from different sales strategies and key customers, offering insights critical for strategic decision-making and customer relationship management.
Key Terms to Know
- Hunters/Farmers/Oversea Contribution: Breakdown of revenue contributions from distinct sales strategies, helping in evaluating the effectiveness of sales approaches and resource allocation.
- Top 20 Customers Contribution: Analysis of revenue generated by the top 20 customers, providing visibility into key accounts and informing customer-centric strategies for revenue growth and retention.
Freight Financial Analytics 3
Freight Financial Analytics 3 offers insights into monthly and cumulative volume metrics, along with daily volume trends. Additionally, it highlights the top salesman based on volume contributions.
Key Terms to Know
- Monthly Volume: Tracks the volume of freight handled on a monthly basis, providing visibility into operational performance over time.
- Cumulative Volume: Presents cumulative freight volume data, allowing for trend analysis and long-term performance evaluation.
- Daily Volume Trends: Displays daily fluctuations in freight volume, helping in identifying patterns and optimizing resource allocation.
- Top Salesman by Volume: Identifies the most productive salesperson based on their contribution to freight volume, enabling recognition of top performers and benchmarking against targets.
Dashboard Template Insights
The dashboard wireframe provides a comprehensive view of:
- Financial metrics such as turnover, profit before tax (PBT), contribution, and volume, enabling stakeholders to assess the financial health of their freight operations.
- Monthly, cumulative, and forecasted values allow for detailed tracking of financial performance over time, facilitating trend analysis and identification of areas for improvement.
- The top salesman by volume sheds light on individual contributions to freight volume, fostering a culture of recognition and incentivizing sales excellence.
Conclusion
The Freight Financial Analytics dashboard template equips stakeholders with essential financial data to make informed decisions and drive operational efficiency in freight management. By tracking key metrics and highlighting sales performance, it enables organizations to optimize their financial performance and enhance productivity across their freight operations.