
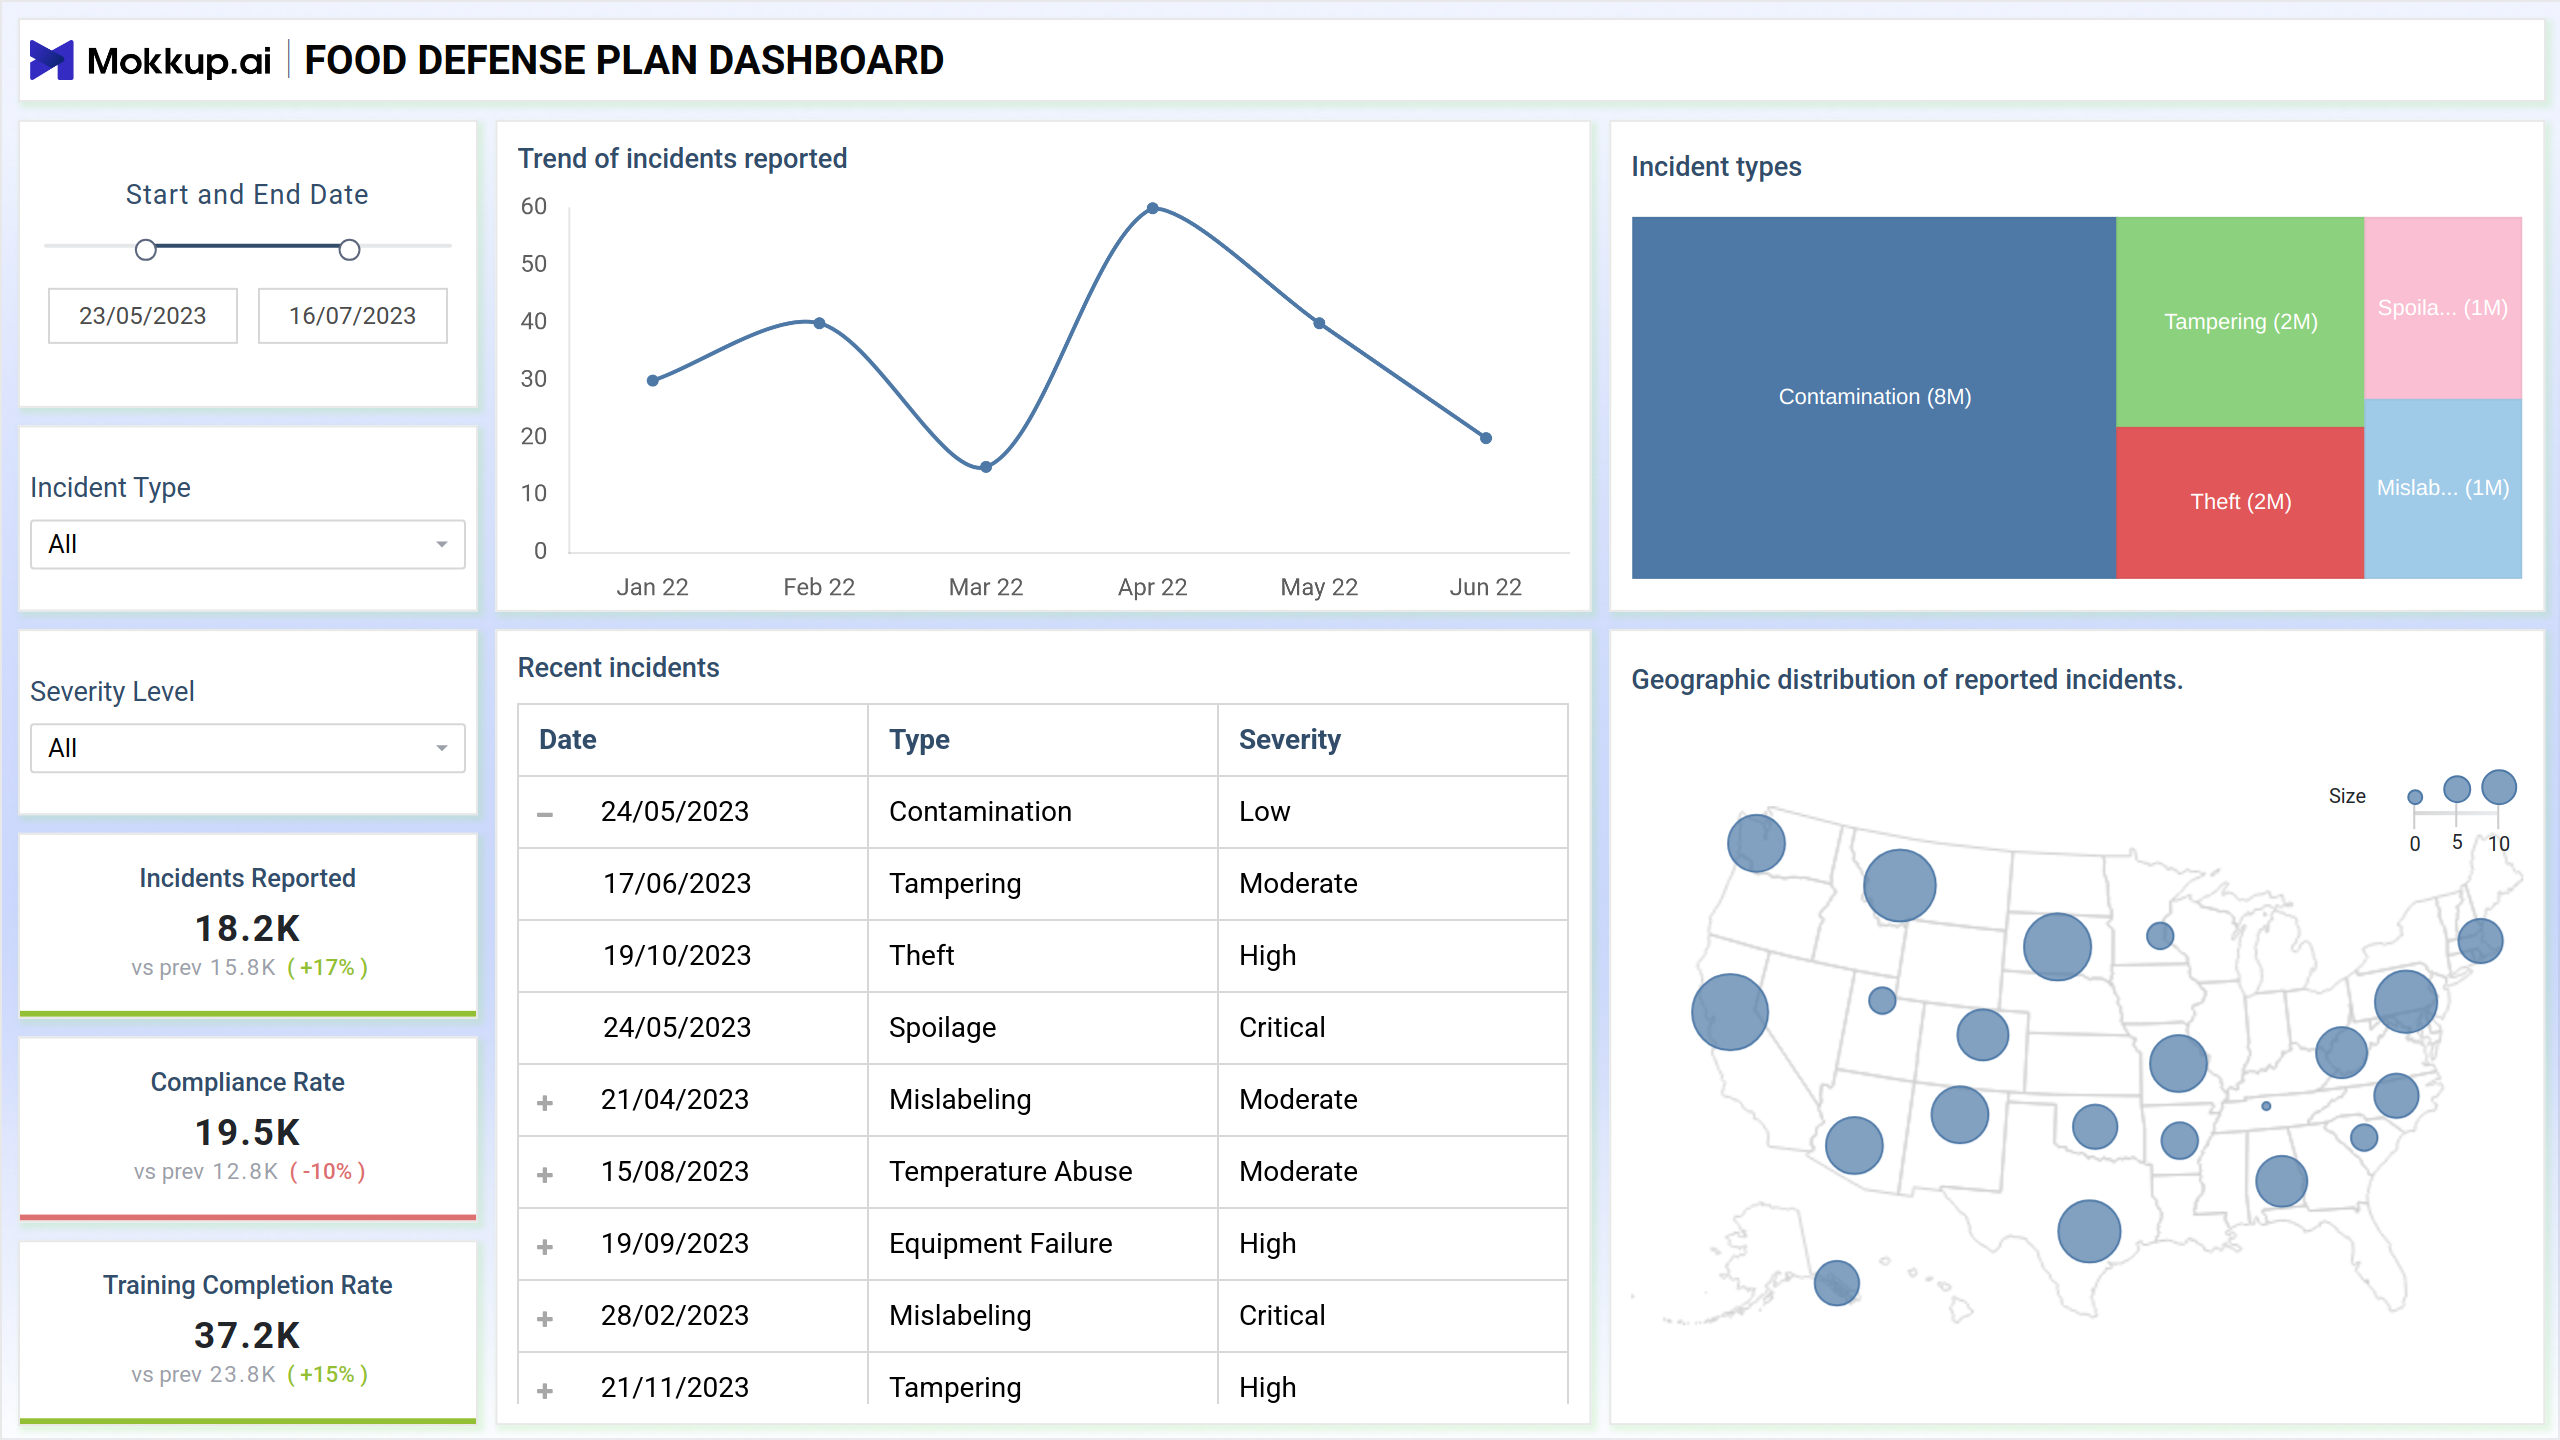
The food defense plan dashboard template is a comprehensive interface designed to ensure the safety and security of your food supply chain. This dashboard provides crucial insights into vulnerability assessments, mitigation strategies, and compliance status. With clear visualization of key data points, it aids in swiftly identifying potential threats, implementing protective measures, and maintaining regulatory standards to safeguard public health.
The dashboard wireframe comprises two screens: Dashboard Overview, & Incident Reports; each is explained briefly below.
Dashboard Overview
This view provides an overview of the progress of a food defense plan, which is a plan that helps to protect food from intentional contamination. The dashboard includes information on incident reports, compliance rates, training completion rates, and the geographic distribution of reported incidents.
Key Terms to Know
- Trend of Incidents Reported: Shows the pattern and frequency of incidents over time, highlighting any significant changes.
- Incident Types: Categorizes and displays the different types of incidents, providing a clear overview of common threats.
- Compliance Rate: Measures the adherence to food safety and security regulations, ensuring standards are met.
- Training Completion Rate: Tracks the percentage of employees who have completed necessary food defense training.
- Recent Incidents: Lists the most recent incidents reported, keeping users informed of current issues.
- Geographic Distribution of Reported Incidents: Maps out where incidents have occurred, identifying regional vulnerabilities.
Incident Reports
This view helps to track and analyze incidents reported to the food defense plan. The dashboard is designed to be easy to use and can be customized to fit your specific needs. It provides a quick overview of the number of incidents reported by incident type over a chosen date range. It also includes a graph that shows the trends in incident reporting over time.
Key Terms to Know
- Incident Types by Severity: Classifies incidents based on severity levels, aiding in prioritizing response efforts.
- Incident Trends & Severity: Analyzes trends in incident occurrence and severity over time, facilitating proactive mitigation strategies.
- Incident Resolution Time: Tracks the average duration from incident report to resolution, ensuring prompt handling.
- Average Response Time: Measures the average time taken to respond to incidents once reported, optimizing incident management efficiency.
- Incident Reporting Rate: Calculates the frequency of incident reports within a specified period, indicating responsiveness and vigilance.
Dashboard Template Insights
Here are four key achievements of this dashboard wireframe:
- Provides detailed analysis of potential vulnerabilities in the food supply chain, aiding in the prevention of contamination or tampering.
- Outlines effective measures to address identified risks, ensuring robust defense mechanisms.
- Tracks adherence to regulatory standards, helping maintain food safety and security protocols.
- Facilitates quick response planning and execution in case of security breaches, minimizing impact on public health.
Conclusion
In conclusion, this wireframe serves as a vital tool for safeguarding food safety and security. By offering comprehensive insights into incident types, severity trends, resolution times, response efficiency, and reporting rates, it empowers stakeholders to proactively protect against threats. This platform ensures compliance with regulations, enhances readiness through data-driven strategies, and reinforces trust in the integrity of the food supply chain.