
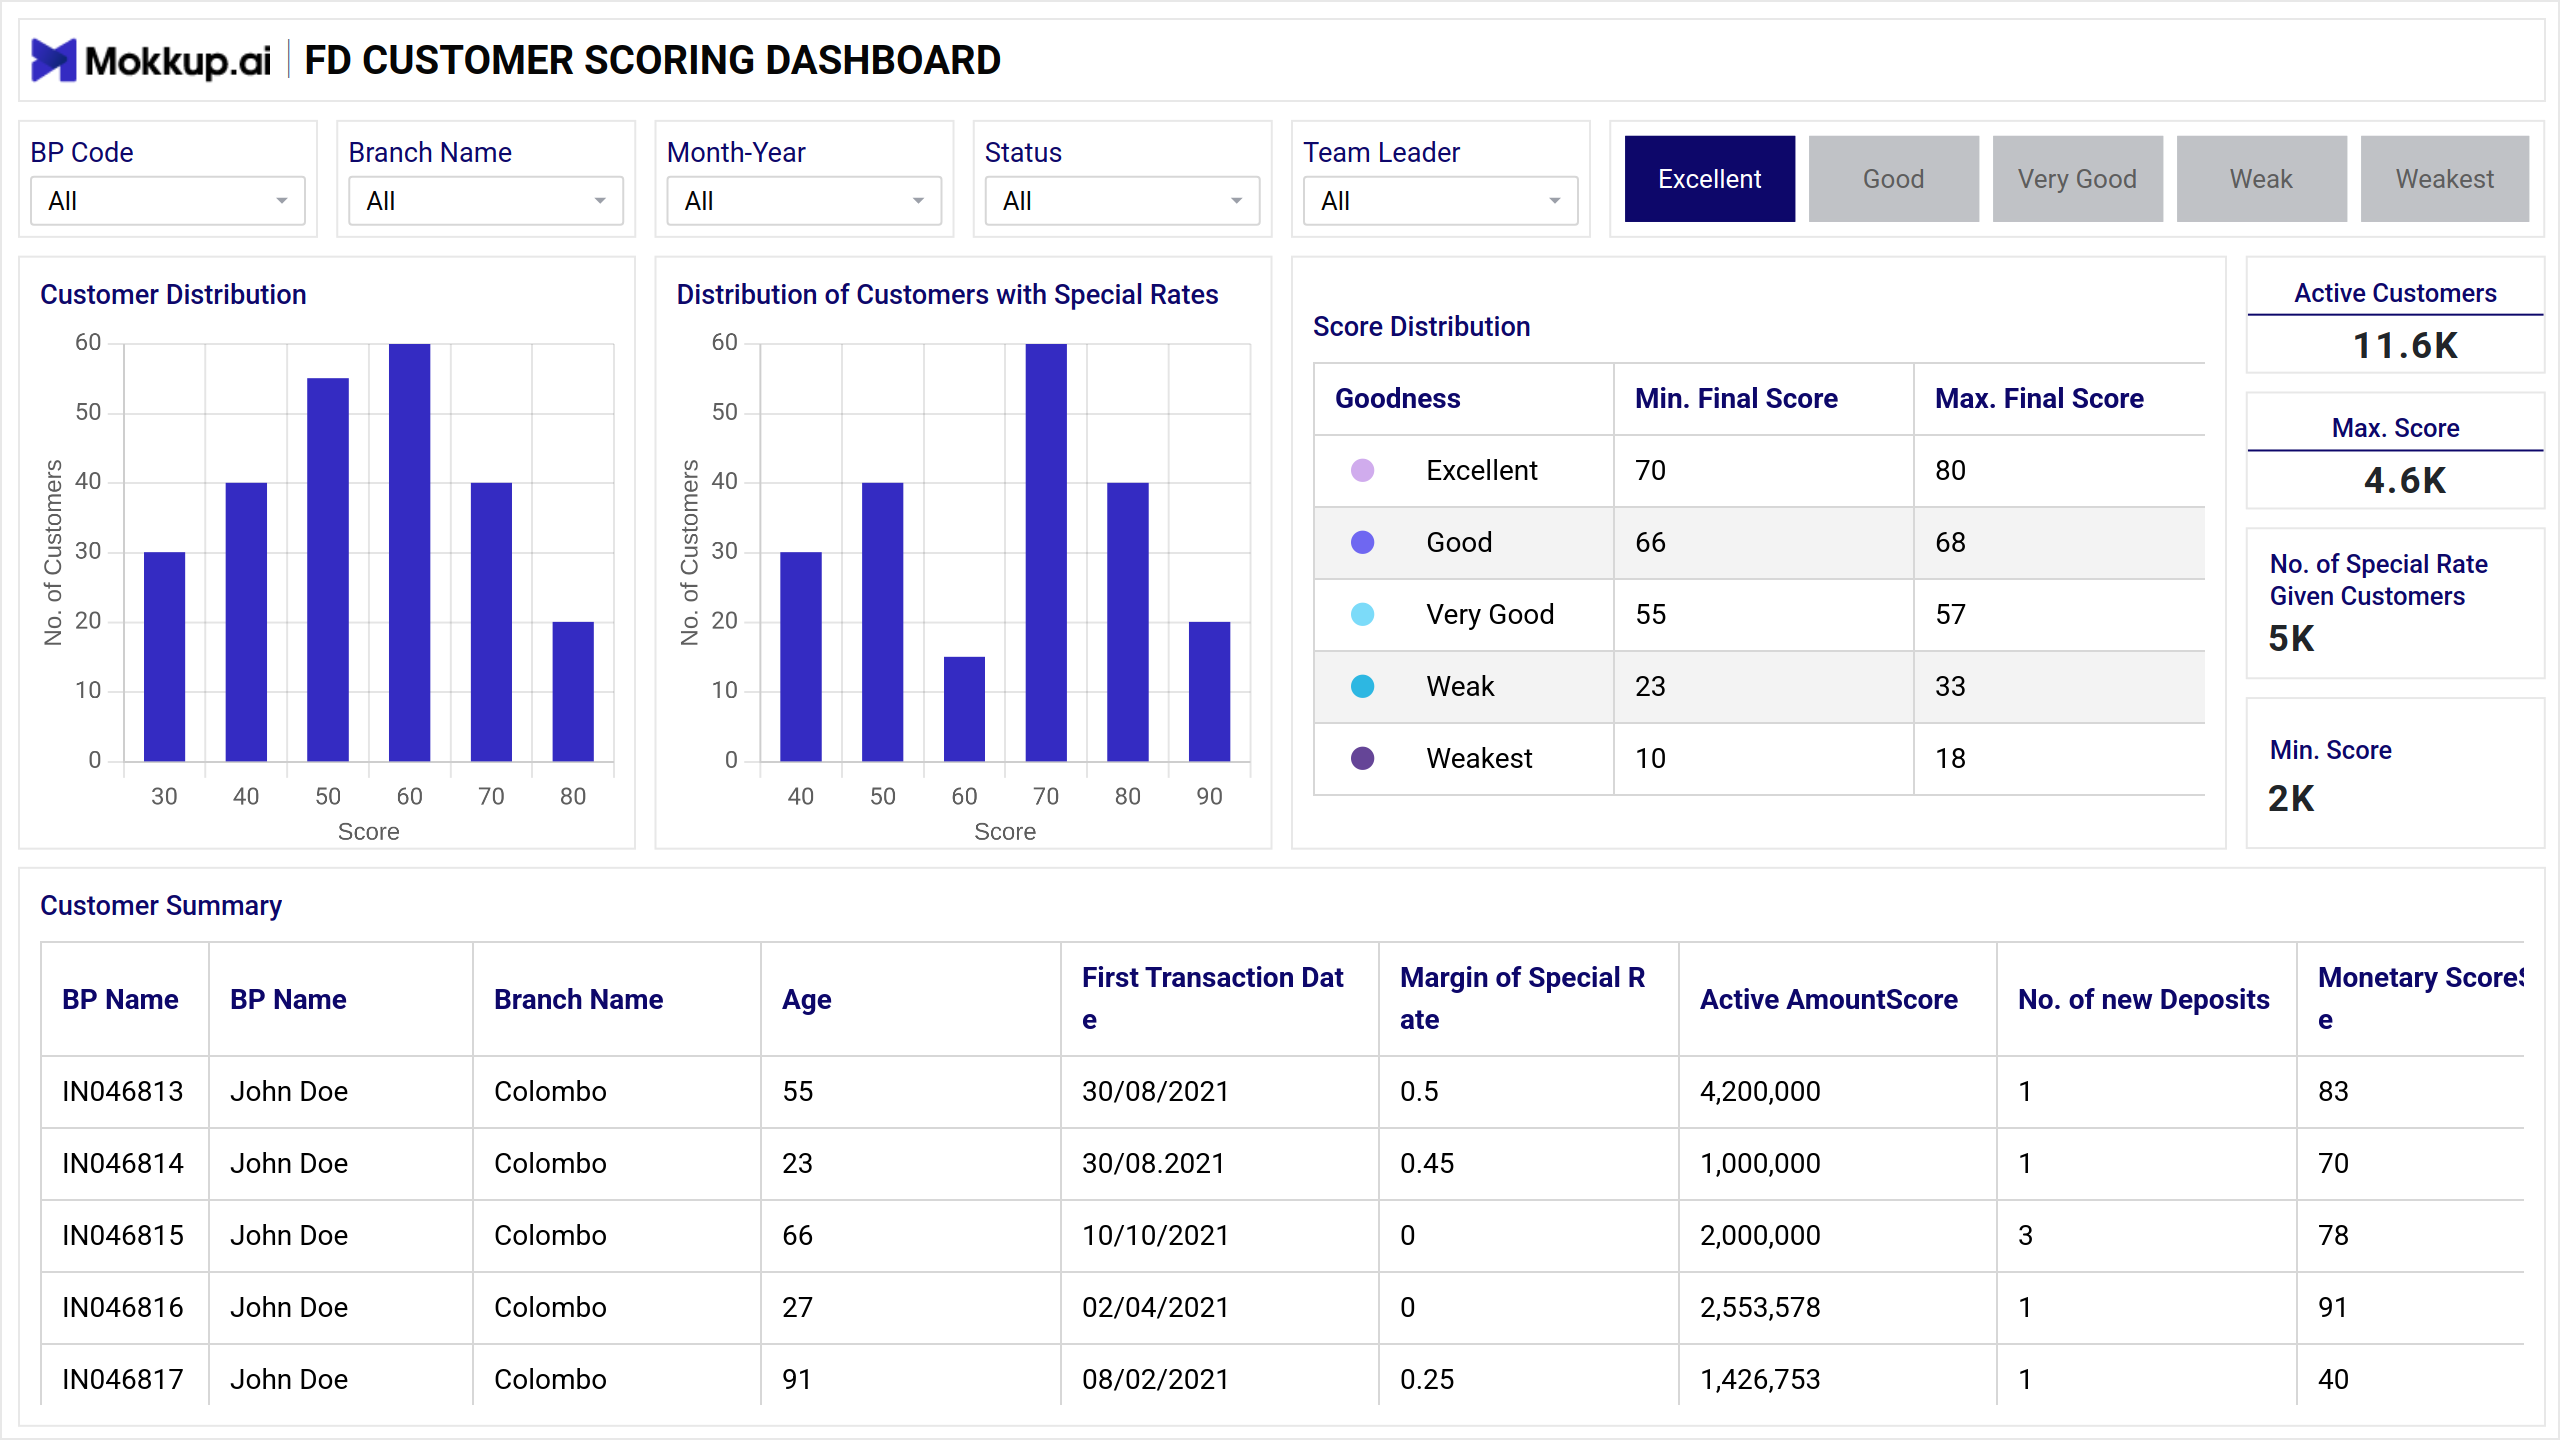
This dashboard gives a 360-degree view of the institution's fixed deposits, demonstrating mokkup.ai's dashboard wireframe expertise. Customer Scoring, Churn Analysis, and FD Forecasting are strategically organized into three parts that analyze different aspects of fixed deposit.
It helps identify client patterns and FD rates. It also identifies clients with special rates and links them to their scores. Tracking totals and distributions helps organizations spot patterns. Customization allows age, income, and other parameters to be classified.
Screen 1: FD Customer Scoring Dashboard
This section summarizes account holders. Create flexible versions with filters to show consumer data from the wireframe. Larger organizations may need customization to meet the dashboard's needs.
Key Terms to consider:
- Customer Distribution - Examining the dispersion of customers across different segments or categories for targeted analysis and decision-making.
- Score Distribution - Analyzing the spread of scores among a set of data points, providing insights into the distribution patterns.
- Customer Summary - Providing a concise overview of key metrics and characteristics of the customer base for comprehensive understanding and management.
Screen 2: FD Churn Dashboard
The churn score distribution might be based on income, age, or area. This score lets organizations evaluate their performance within constraints. The quantity of customers and their scores provide useful information about absolute turnover numbers.
Key Terms to consider:
Churn Score Distribution - Evaluating how churn scores are dispersed among customers, offering insights into the risk of customer attrition across various segments.
Screen 3: FD 12 Month Prediction Dashboard
Historical performance analysis is essential for predicting. This section summarizes quarters, branches, and objective account financial data. Businesses can adjust this area to meet their quarterly, half-yearly, or other metrics. It tracks historical fixed deposit patterns and allows for customization to meet company needs.
Key Terms to consider:
- Branch Wise Summary - Providing a concise overview of key metrics and performance indicators specific to different brands for strategic analysis and decision-making.
- Periodic Summary - Summarizing key data and trends at regular intervals, facilitating a comprehensive understanding of performance over time.
- Periodic Predictions VS Actual Trends - Comparing predicted outcomes with actual performance at periodic intervals, aiding in evaluating the accuracy of forecasting models and making informed adjustments.
Dashboard Template Insights
Mokkup.ai's comprehensive Fixed Deposit dashboard provides a 360-degree view, strategically organizing FD Customer Scoring, FD Churn Analysis, and FD 12 Month Prediction to offer insights into different aspects of fixed deposits. The dashboard's adaptability allows organizations to customize and track patterns, emphasizing user safety and effective business practices.
Conclusion
Fixed deposits are large, so companies must have the knowledge to execute key user safety and business practices. The dashboard wireframe's versatility is evident. It lets organizations change the number of pages as required, keeping the dashboard current and effective as their requirements change.