
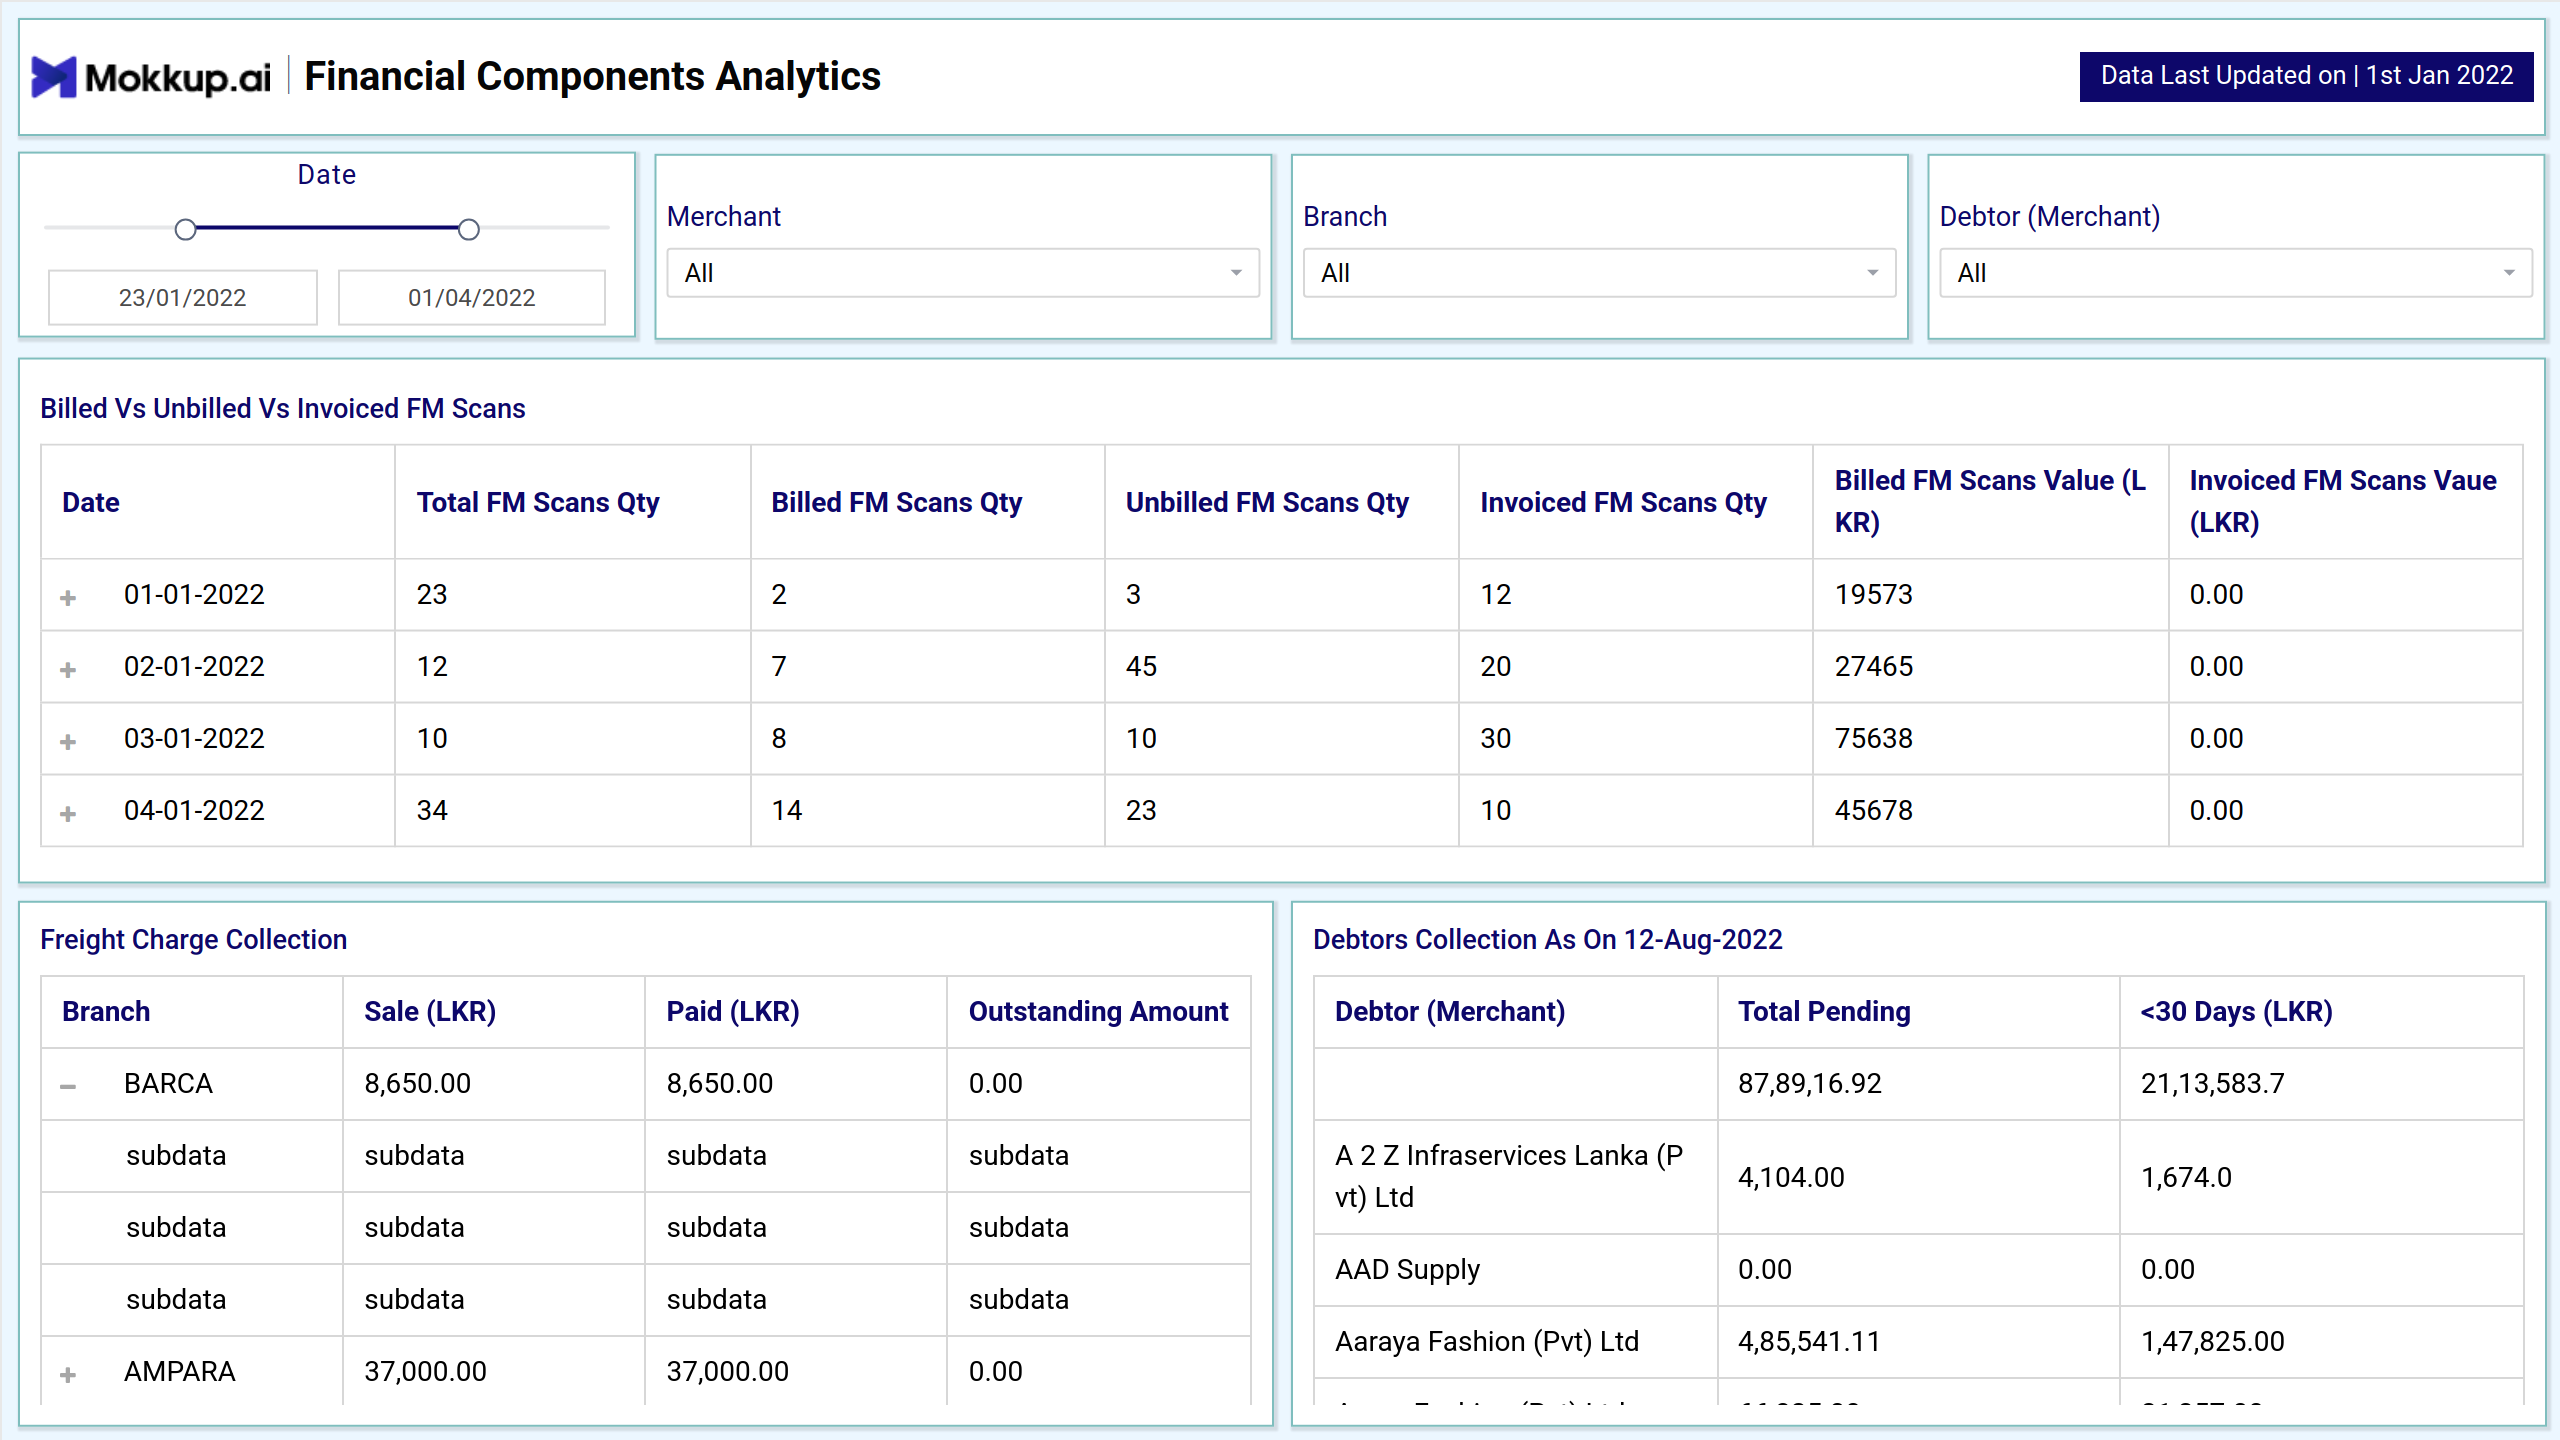
The Financial Components Analytics Dashboard template specializes in freight industry financial analysis. This dashboard tracks freight industry key performance indicators(KPIs) that reveal its health and efficiency. It helps consumers make educated choices by providing a complete perspective of freight company finances. Cost analysis, financial forecasting, and other freight-related financial topics are discussed.
Key Terms to Know
- Total FM Scans Qty: The total count of freight scans conducted.
- Billed FM Scans Quantity: The quantity of billed freight scans.
- Unbilled FM Scans Qty: The number of freight scans awaiting billing.
- Invoiced FM Scans Qty: The number of already invoiced freight scans.
- Billed FM Scans (LKR): The cumulative monetary value of billed freight scans.
- Sale (LKR): The total revenue generated from sales.
- Paid (LKR): The total sum of money paid.
- Debtor Collection: The total funds collected from debtors, which may include payments related to order management.
The dashboard wireframe shows FM scans, freight charge collection, and debtor collection statistics. It shows total, billed, and unbilled FM scan quantity and value, freight charge collection for particular branches, and debtor collection for total pending amounts less than 30 days late. Filtering by date, merchant, branch, and debtor helps users monitor, analyze, and manage their data.
Dashboard Template Insights
The wireframe offers a detailed analysis to enhance business operations and financial decision-making.
- It offers a comprehensive overview of various data types related to FM scans, freight charge collection, and debtor collection.
- Displays key metrics such as total/billed/unbilled FM scan quantity and value, freight charge collection per branch, and debtor collection for total pending amounts less than 30 days overdue.
- Provides data filtering options by date, merchant, branch, and debtor (merchant).
- Enhances user capabilities in tracking, analyzing, and managing data in an organized and efficient manner.
- Empower businesses to elevate operational efficiency and make informed decisions regarding freight, logistics, and financial analysis.
Conclusion
The dashboard wireframe simplifies FM scans, freight charge collection, and debtor collection data monitoring, analysis, and administration. It increases corporate productivity by providing a clear, structured picture of this data.
Users obtain information to make educated freight, logistics, and financial analysis choices. Data filtering by date, merchant, branch, and debtor (merchant) allows the dashboard to personalize analysis. It improves operational efficiency and data-driven decision-making.