An online bus ticketing dashboard is a visual representation of the key performance indicator (KPI) for an online bus ticketing system. The dashboard provides a centralized view of data, such as ticket sales, customer satisfaction, and operational efficiency. Bus operators can use this information to track performance, identify areas for improvement, and make informed decisions about the business. The dashboard can be customized to display the most important KPI to the bus operator. For example, a bus operator focused on increasing ticket sales should include KPIs such as the number of tickets sold, the average ticket price, and the conversion rate.
Screen 1: Revenue Overview
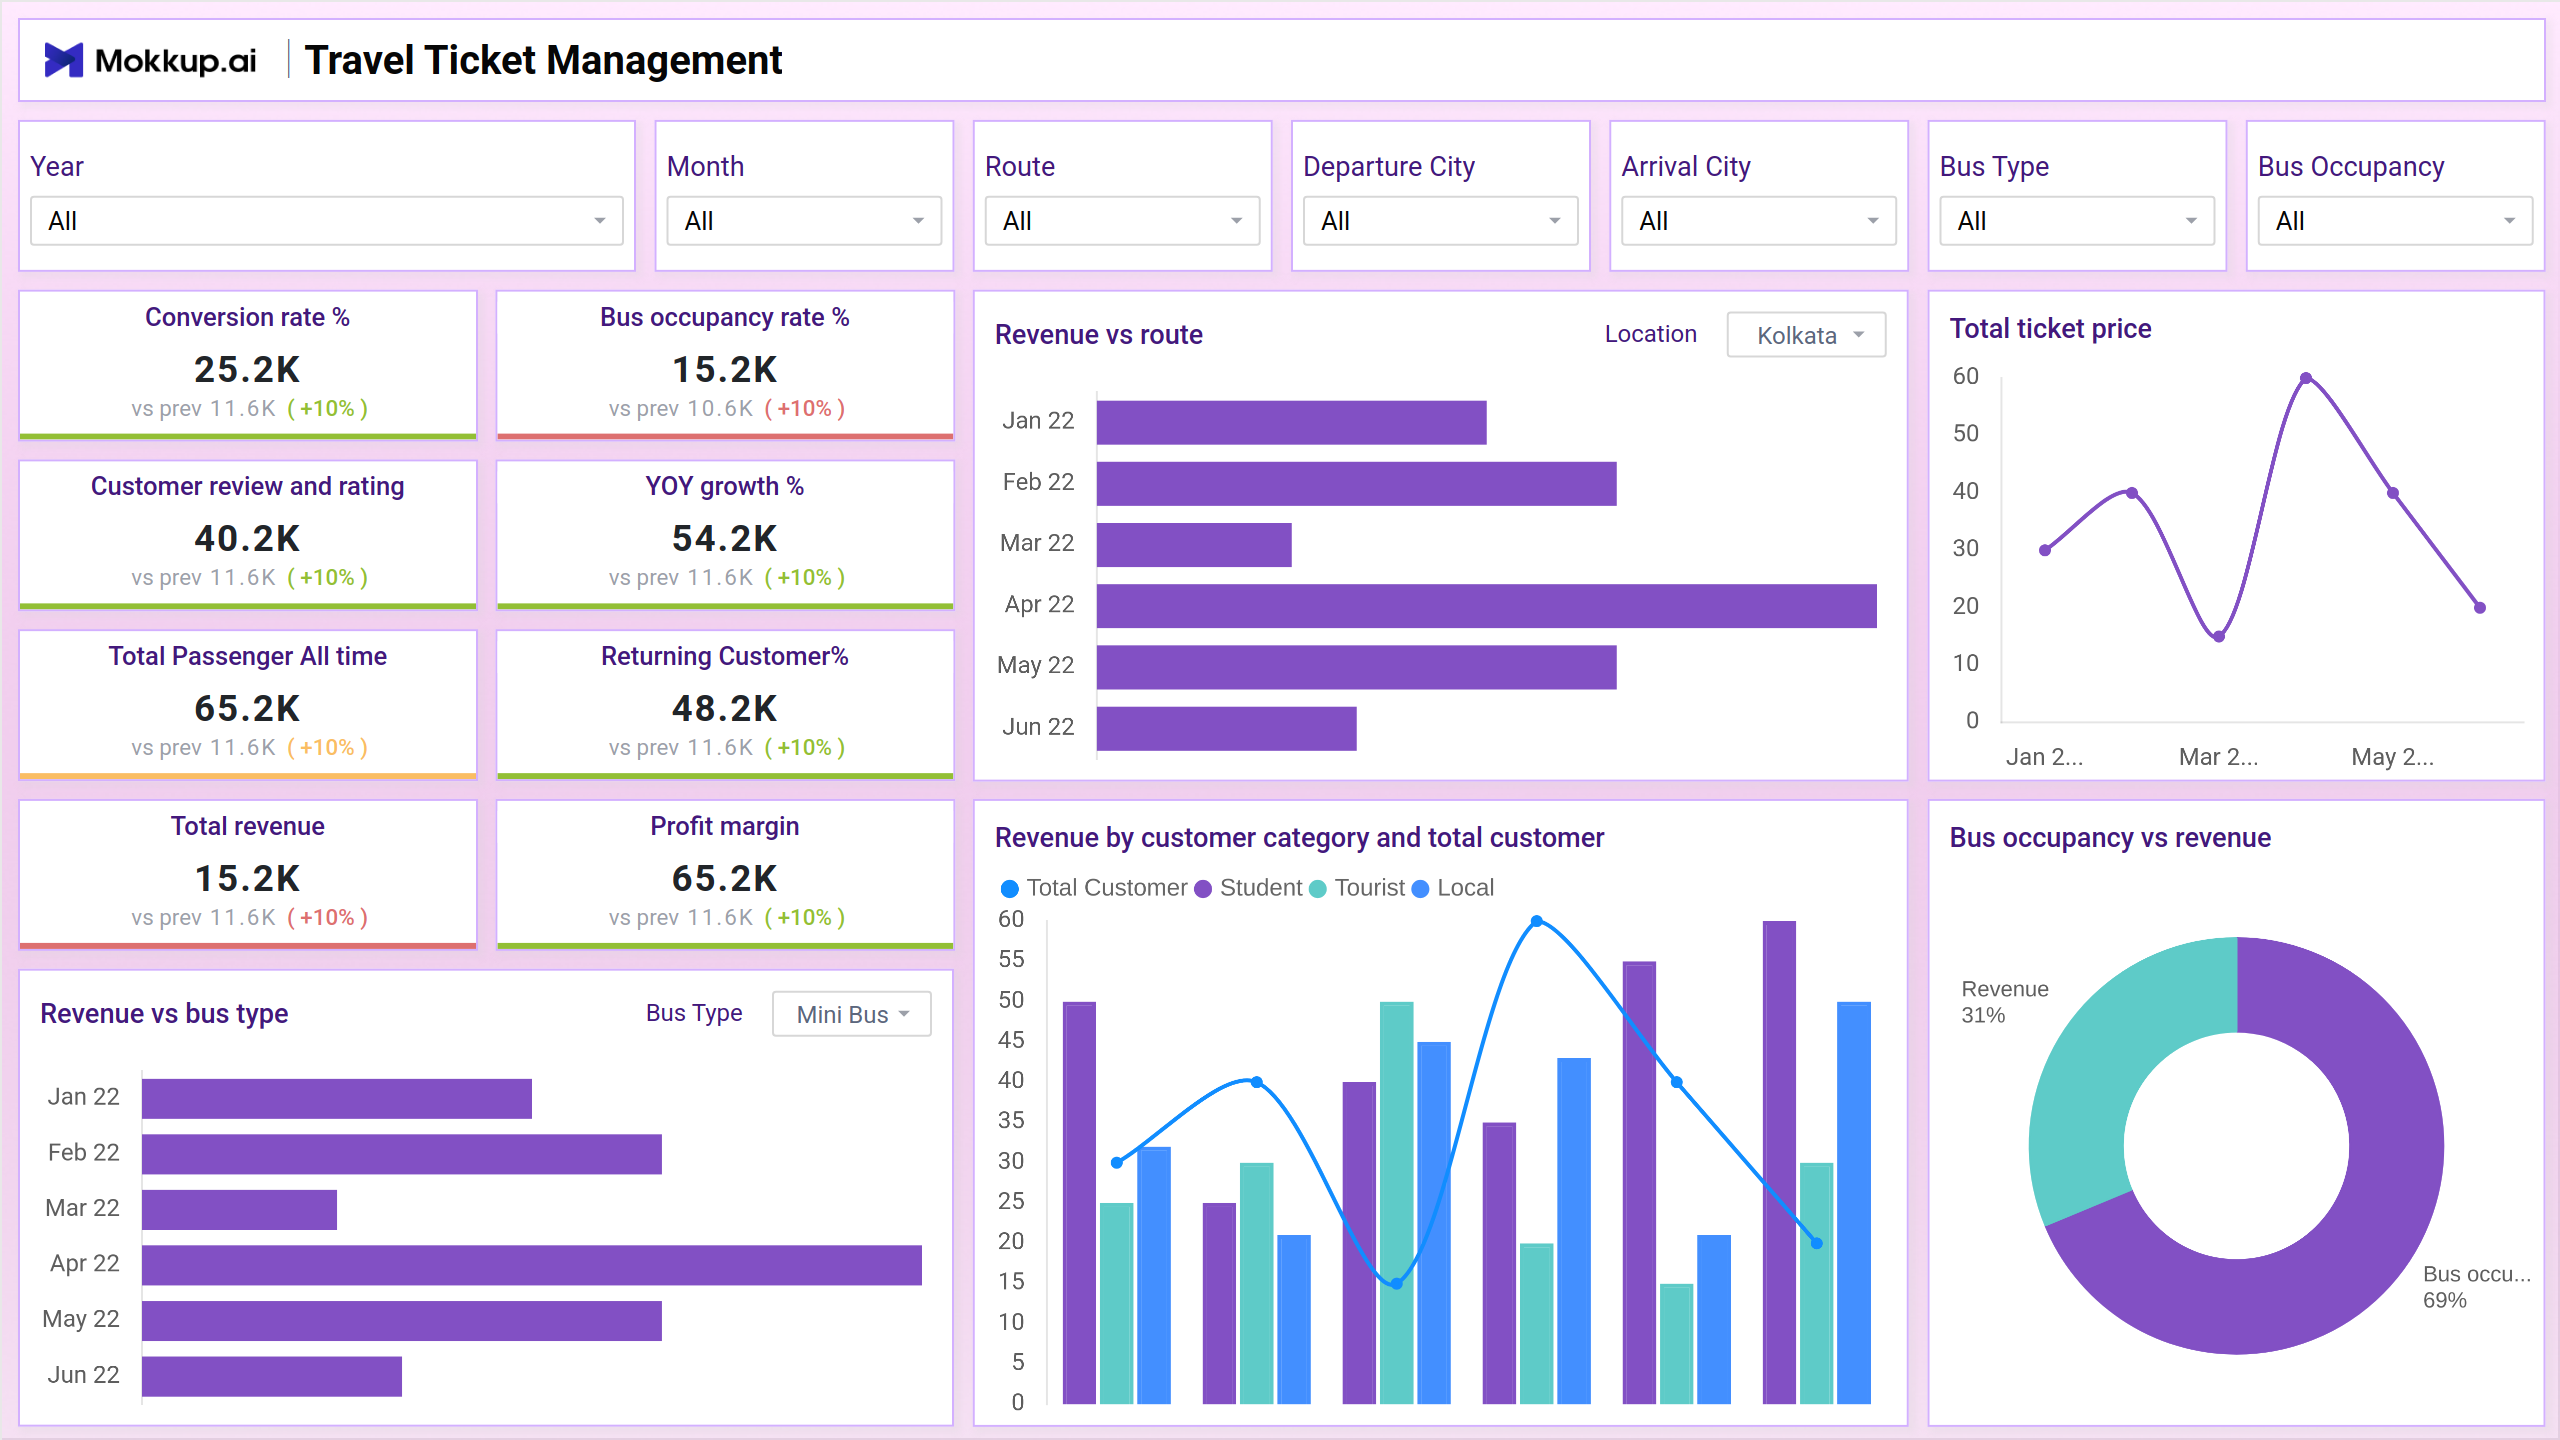
It provides a consolidated visual representation of key performance indicators, focusing on revenue-related metrics. This includes insights into ticket sales, revenue distribution across different routes, total sales over time, month-over-month revenue trends, and an overview of revenue categorized by bus type. The customizable nature of the dashboard allows bus operators to tailor the displayed KPIs according to their specific business goals, empowering them to track overall performance, pinpoint areas for enhancement, and make well-informed decisions to optimize the efficiency and profitability of the online bus ticketing system.
Key Terms to consider:
- Conversion Rate % - Measuring the percentage of potential customers who become actual paying customers, reflecting the effectiveness of sales efforts.
- Bus Occupancy Rate % - Indicating the percentage of seats filled on a bus, providing insights into operational efficiency and revenue optimization.
- YOY Growth % - Representing the year-over-year percentage change in business metrics, showcasing overall growth or decline.
- Returning Customer % - Reflecting the percentage of customers who return for repeat business, a key indicator of customer loyalty and satisfaction.
- Profit Margin - Calculating the percentage of profit relative to total revenue, indicating the efficiency of cost management and revenue generation.
- Revenue VS Route - Analyzing the correlation between revenue generated and specific bus routes to optimize route planning and resource allocation.
- Total Ticket Price - Representing the overall price collected from ticket sales, contributing to the total revenue generated.
- Bus Occupancy VS Revenue - Examining the relationship between bus occupancy and revenue, highlighting the efficiency of maximizing revenue through optimal seat utilization.
Screen 2: Sales and Revenue
It delves into specific KPIs related to sales performance and revenue generation. This screen provides a detailed analysis of metrics such as total sales with cost considerations, revenue distribution by route, sales trends over time, and revenue segmentation by bus type. Tailored to the bus operator's objectives, this screen allows a focused examination of key indicators essential for optimizing sales strategies, identifying revenue-generating routes, and making strategic decisions to enhance overall operational efficiency and financial success within the online bus ticketing system.
Key Terms to consider:
- Revenue and Booking - Monitoring the correlation between revenue and booking metrics to assess the efficiency of sales and operational performance.
- Total Sales CM - Evaluating total sales after considering costs and expenses, providing a clear picture of profitability.
- Revenue by Route - Analyzing revenue distribution across bus routes to optimize resource allocation and identify high-performing routes.
- Total Sales w.r.t Time - Examining the overall sales trends over time to identify patterns and make informed decisions on promotional strategies or operational adjustments.
- Total Revenue by MOM - Comparing total revenue month-over-month to track growth trends and assess the effectiveness of business strategies.
- Revenue by Bus Type - Categorizing revenue based on bus types to identify the most profitable vehicle categories and optimize fleet management.
- Total Ticket Sales - Summarizing the total number of tickets sold provides a key metric for assessing customer demand and revenue potential.
Screen 3: Customer Segmentation
This includes insights into customer preferences, satisfaction scores, booking patterns based on demographics, and loyalty rates. By providing a nuanced understanding of customer behavior and preferences, this screen assists bus operators in tailoring marketing strategies, enhancing customer satisfaction, and fostering brand loyalty, ultimately contributing to improved overall operational efficiency and business success in the online bus ticketing system.
Key Terms to consider:
- Customer Rating Over Route - Evaluating and displaying customer ratings specific to different bus routes, providing insights into route-based service satisfaction.
- Customer Segment Details - Present comprehensive details on customer segments, allowing a nuanced understanding of preferences and behaviors.
- Revenue VS Route - Analyzing the correlation between revenue generated and specific bus routes to optimize route planning and resource allocation.
- Average Ticket Price-Customer Category - Calculating and displaying the average ticket price within different customer categories, aiding in pricing strategies tailored to diverse segments.
- Revenue by Customer Category and Total Customer - Providing a breakdown of revenue generated by distinct customer categories alongside the total customer count, facilitating targeted marketing and revenue optimization strategies.
Dashboard Template Insights
The Online Bus Ticketing Dashboard offers a centralized and customizable view of crucial KPIs for bus operators, enabling them to make informed decisions to optimize performance, profitability, and customer satisfaction. With screens emphasizing revenue metrics, sales and revenue analysis, and customer segmentation insights, the dashboard is a modern tool to streamline and enhance the bus ticketing process in response to technological advancements in the travel industry.
Conclusion
The Online Bus Ticketing Dashboard represents a pivotal tool in modernizing and streamlining the bus ticketing process. As technology continues to shape the travel industry, this dashboard is a prime example of how innovation can enhance the overall experience for all stakeholders involved in the bus transportation sector. Bus operators can gain a clear and concise view of their business performance using an online bus ticketing dashboard. This information can be used to make informed decisions to help the business grow and succeed.