
What is an Eye Hospital Finance Dashboard?
An Eye Hospital Finance Dashboard is a centralized financial management tool designed for hospital administrators, CFOs, and financial controllers to monitor fiscal performance in real time. This healthcare financial dashboard provides comprehensive visibility into operating margins, net income, accounts receivable, collection rates, expense breakdowns, and payer mix analytics. It enables financial leaders to track profitability, manage cash flow, and make data-driven financial decisions without compiling reports from multiple systems.
How To Create Eye Hospital Finance Dashboards
You don't need to build your financial report from scratch. Start with a ready-to-use Eye hospital finance dashboard template from Mokkup. Here's how to implement it:
1. Create or Log in to Your Mokkup Account
Start by signing up on Mokkup using your email. Existing users can simply log in to access the dashboard templates.
2. Choose and Customize Your Dashboard Template
Locate the Eye Hospital Finance Dashboard template in the Templates section. Use the intuitive drag-and-drop editor to modify KPIs, adjust date ranges, customize facility filters, and tailor the layout to your specific financial reporting needs.
3. Export to Your BI Tool
Once your dashboard wireframe is finalized, export it directly to Power BI or Tableau using the BI Tool Export feature. You can also download the dashboard as PDF, PNG, or JPEG files, embed it in reports, or share it with your financial team for collaborative analysis.
Note: This is a Pro template requiring a Mokkup Pro subscription for full customization and export capabilities.
Eye Hospital Finance Dashboard Example
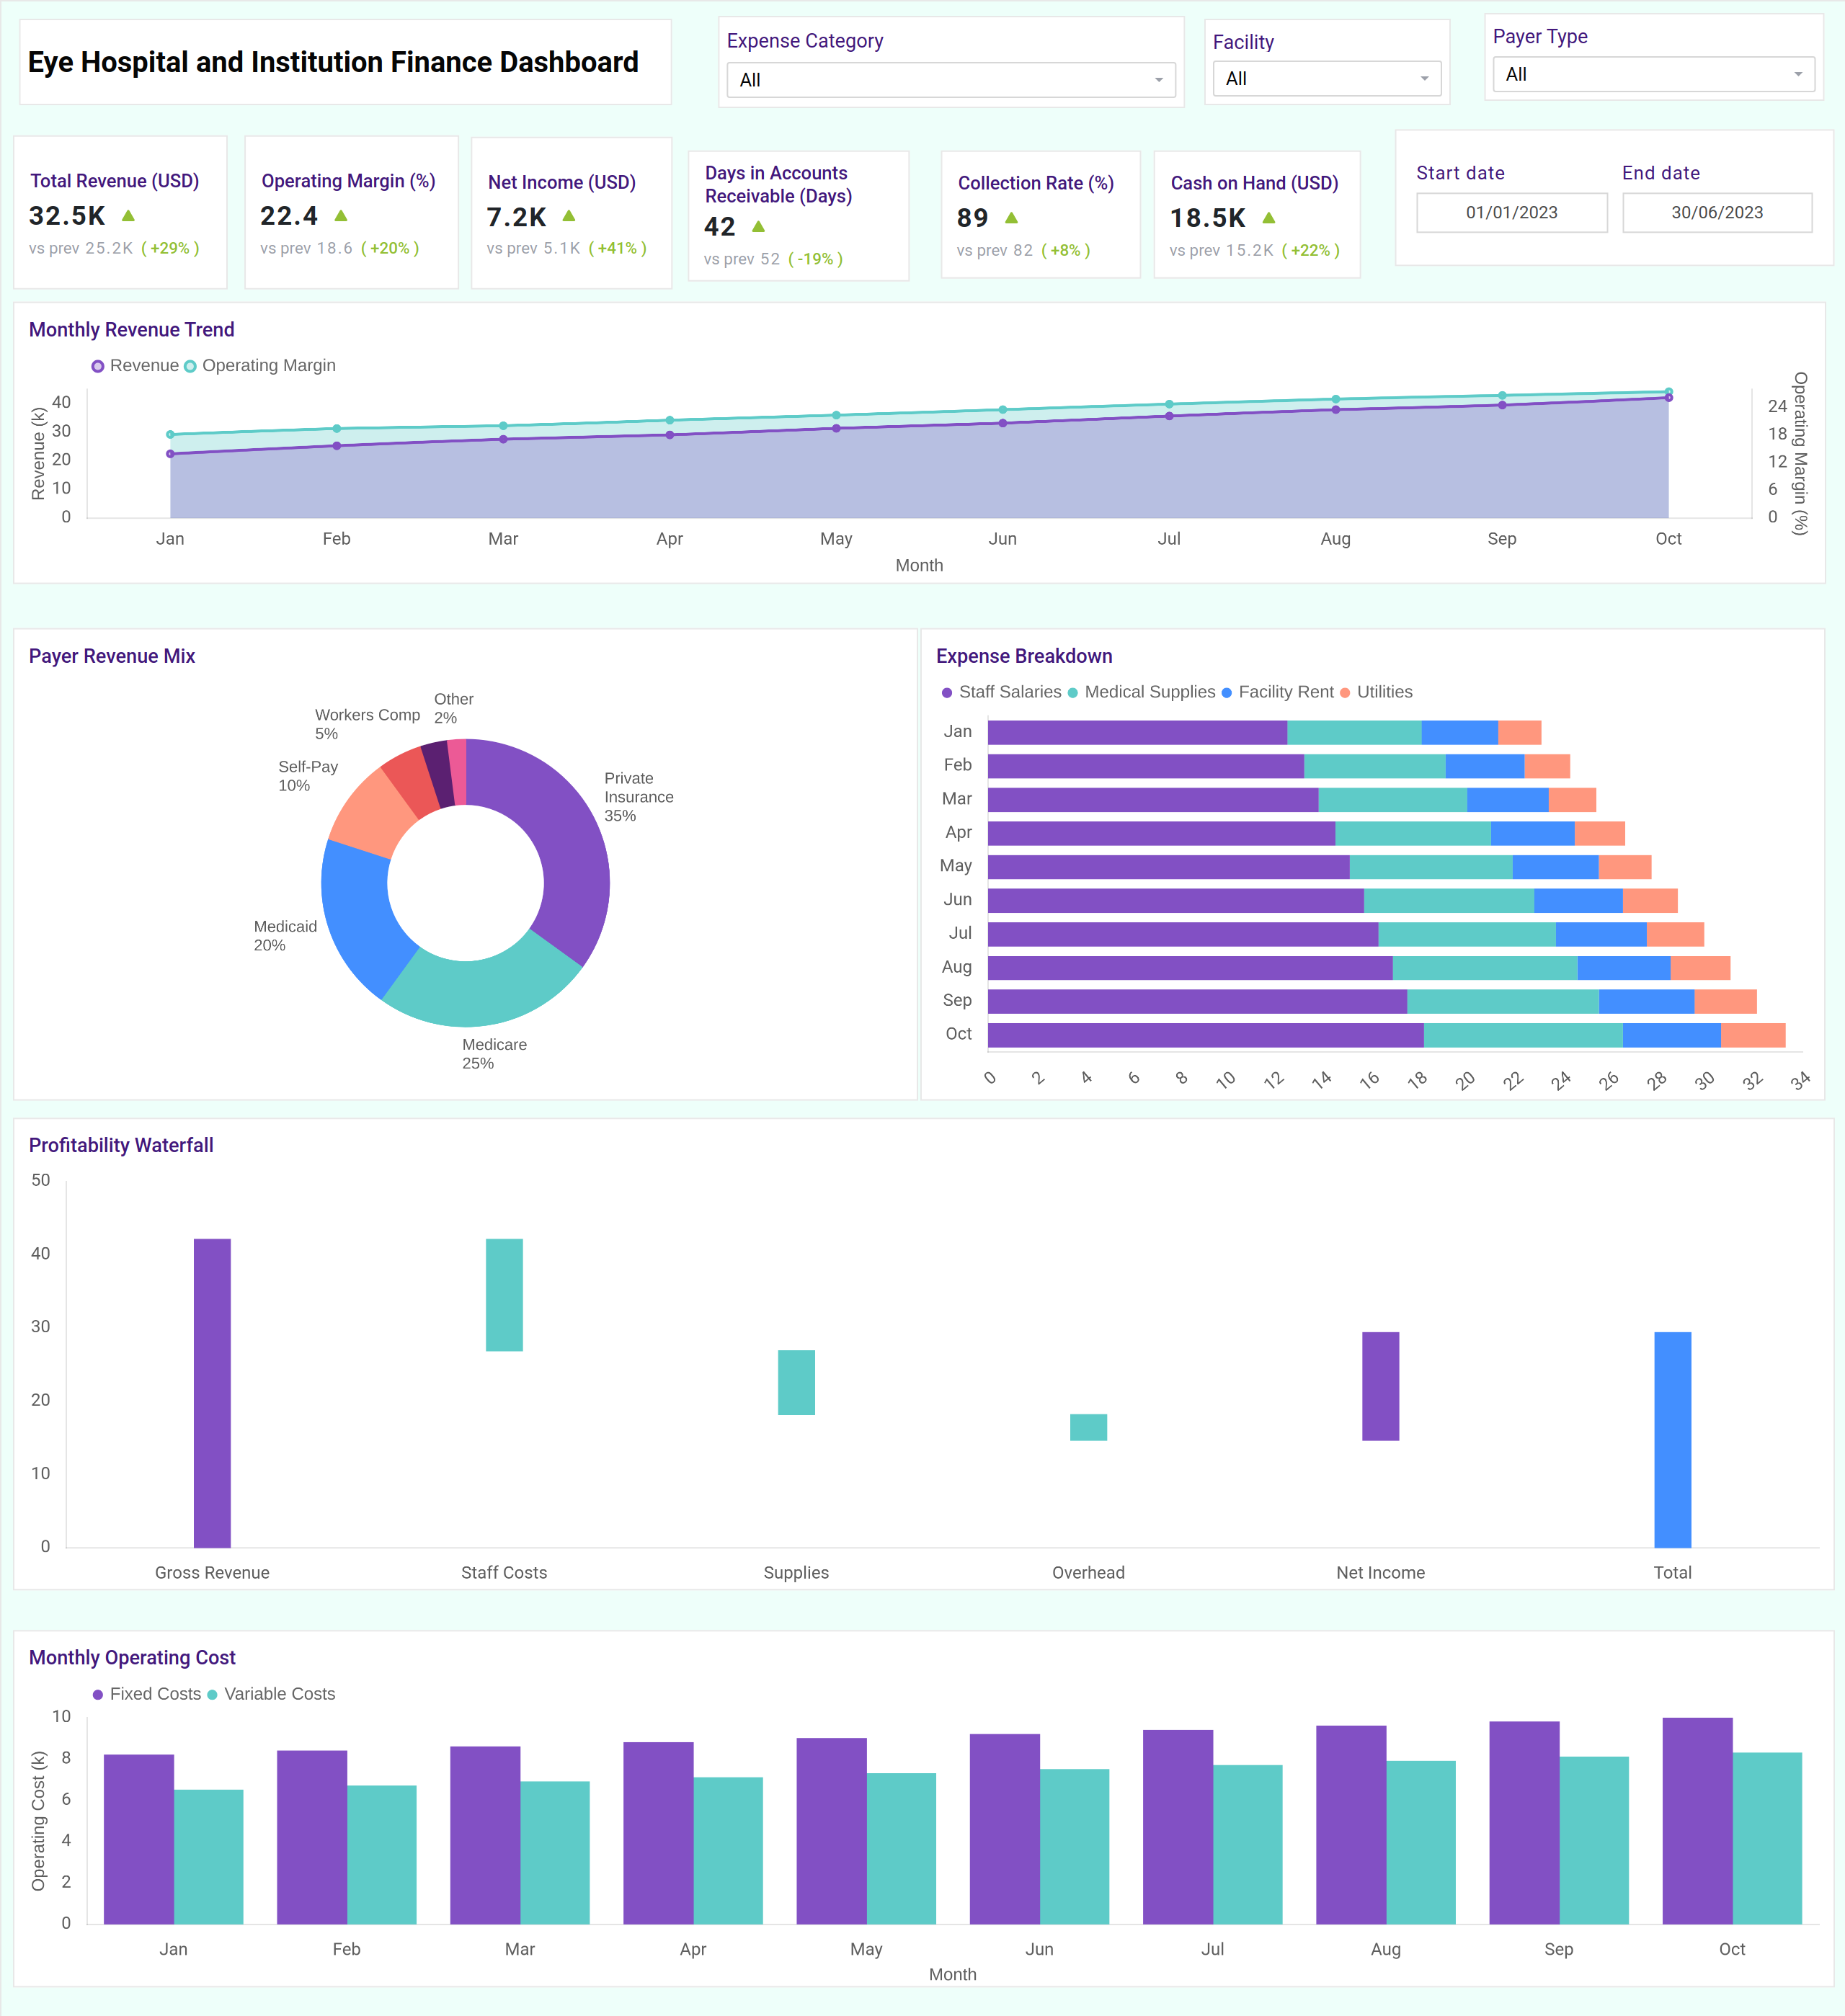
Create your comprehensive Eye hospital financial metrics dashboard with key performance indicators displayed in an organized layout. The healthcare dashboard features KPI cards showing operating margin, net income, days in A/R, and collection rate. Visualizations include expense breakdown charts, revenue by payer mix, monthly revenue trends, and financial flow analysis. Additional metrics like EBITDA margin, claim denial rate, and debt-to-equity ratio provide a complete financial picture, making this an ideal ophthalmology financial reporting tool for institutional decision-making.
Benefits of Eye Hospital Finance Dashboard
An Eye Hospital Finance Dashboard offers significant advantages for financial management:
- Financial Visibility: Real-time tracking of operating margin, net income, and cash flow metrics.
- Expense Management: Detailed breakdown of costs across equipment, facility rent, sales, and medical supplies.
- Revenue Optimization: Payer mix analysis helps identify profitable service lines and payment sources.
- Cash Flow Improvement: Monitoring days in A/R and collection rates enhances revenue cycle performance.
- Compliance Ready: Serves as an ophthalmology financial reporting dashboard for audit and governance requirements.
- Strategic Decision Support: This Medical Institution finance dashboard uses EBITDA margin tracking and industry benchmarking to inform long-term financial planning.
KPIs to Track in Eye Hospital Finance Dashboard
An effective medical finance KPI dashboard should include these essential metrics:
- Operating Margin (%): Current profitability vs. previous periods
- Net Income ($): Absolute profit performance and growth trends
- Days in Accounts Receivable: Efficiency of revenue collection processes
- Collection Rate (%): Effectiveness of billing and collections operations
- Expense Breakdown: Cost allocation across major categories
- Revenue by Payer Mix: Distribution across Medicare, Medicaid, and self-pay sources
- EBITDA Margin: Operational profitability before non-operating factors
- Claim Denial Rate: Billing process effectiveness and revenue leakage points
- Cash on Hand: Liquidity position and financial stability
- Debt-to-Equity Ratio: Financial leverage and risk assessment
Frequently Asked Questions
1. Who should use an Eye Hospital Finance Dashboard?
CFOs, financial controllers, hospital administrators, and board members responsible for financial oversight and strategic planning can use it.
2. Can this dashboard help improve revenue cycle performance?
Yes. By tracking days in A/R, collection rates, and claim denial rates, institutions can identify bottlenecks and improve revenue cycle efficiency.
3. How does it support financial decision making?
The dashboard provides real-time insights into profitability, expense patterns, and payer mix, enabling data-driven decisions on resource allocation and service line investments.