
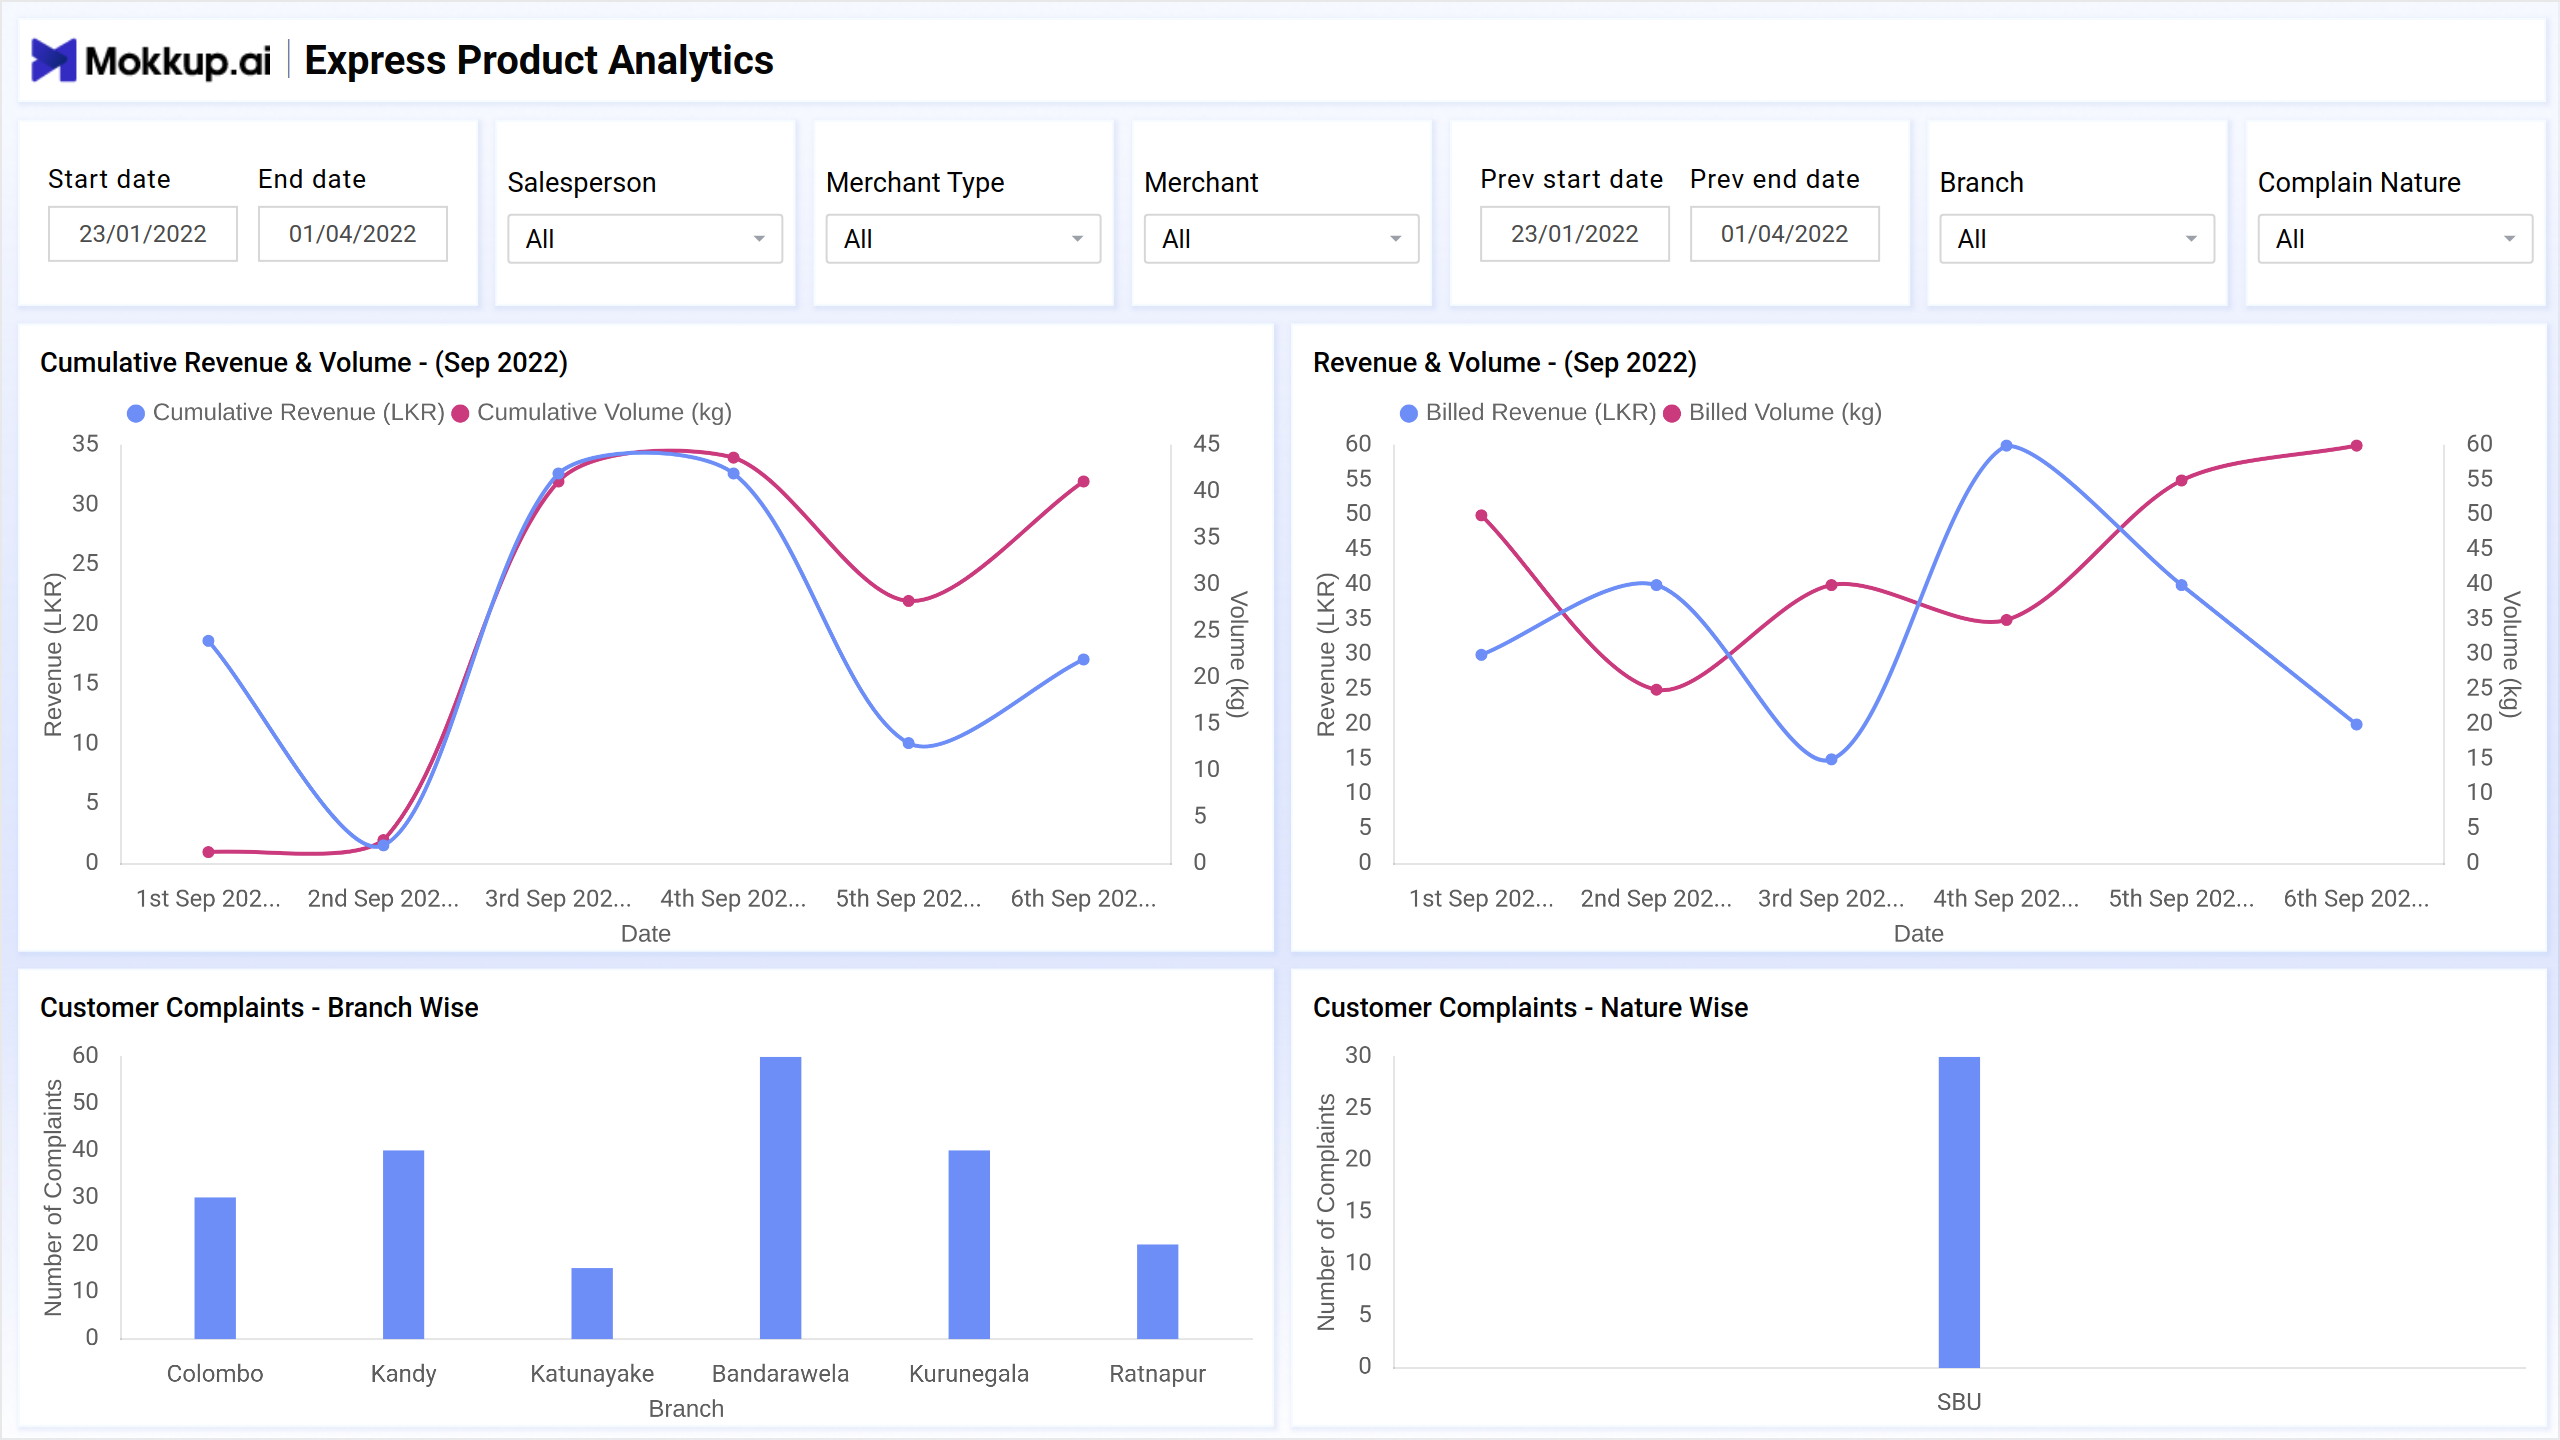
The Express Product Analytics Dashboard template provides a comprehensive overview of key metrics related to express product performance. It includes insights into revenue, volume, and customer complaints, allowing stakeholders to assess the effectiveness and quality of express product services. The dashboard template is an essential wireframe for businesses aiming to optimize their express product operations, enhance customer satisfaction, and drive revenue growth.
Key Terms to Know
- Cumulative Revenue and Volume: Provides an overview of the total revenue and volume generated by express product services over a specified period. It allows stakeholders to track overall performance trends, identify growth patterns, and make strategic decisions based on historical data.
- Revenue and Volume: Breaks down revenue and volume metrics based on billed values. By offering insights into actual revenue generation and volume transported, it helps in financial analysis and resource allocation.
- Customer Complaints Branch and Nature-wise: Presents details on customer complaints categorized by branch and nature. It enables businesses to identify problem areas, address customer concerns, and improve service quality. By monitoring and analyzing complaints, organizations can implement corrective actions to enhance customer satisfaction and reduce complaint rates.
Dashboard Template Insights
The dashboard wireframe provides actionable insights to help in:
- Analyzing cumulative and billed revenue and volume metrics provides valuable insights into the financial performance and operational efficiency of express product services. This analysis helps stakeholders understand the revenue streams and optimize resource allocation to maximize profitability.
- Monitoring customer complaints branch and nature-wise helps in identifying service issues, addressing customer concerns, and improving overall service quality to enhance customer satisfaction. By categorizing complaints, businesses can pinpoint specific areas that require improvement and take targeted actions to resolve issues.
- Tracking key performance indicators (KPIs) over time facilitates informed decision-making and strategic planning to optimize express product services. Continuous monitoring of KPIs ensures that businesses stay on track with their goals and can swiftly respond to any deviations.
Conclusion
The Express Product Analytics Dashboard template is useful for managing and refining express product services. With detailed insights into revenue, volume, and customer complaints, stakeholders may make more informed decisions, improve service standards, increase customer happiness, and drive business growth in the dynamic express delivery sector. Businesses may use the extensive data offered by this dashboard wireframe to manage their operations, improve financial performance, and assure long-term success in the competitive express delivery market.