
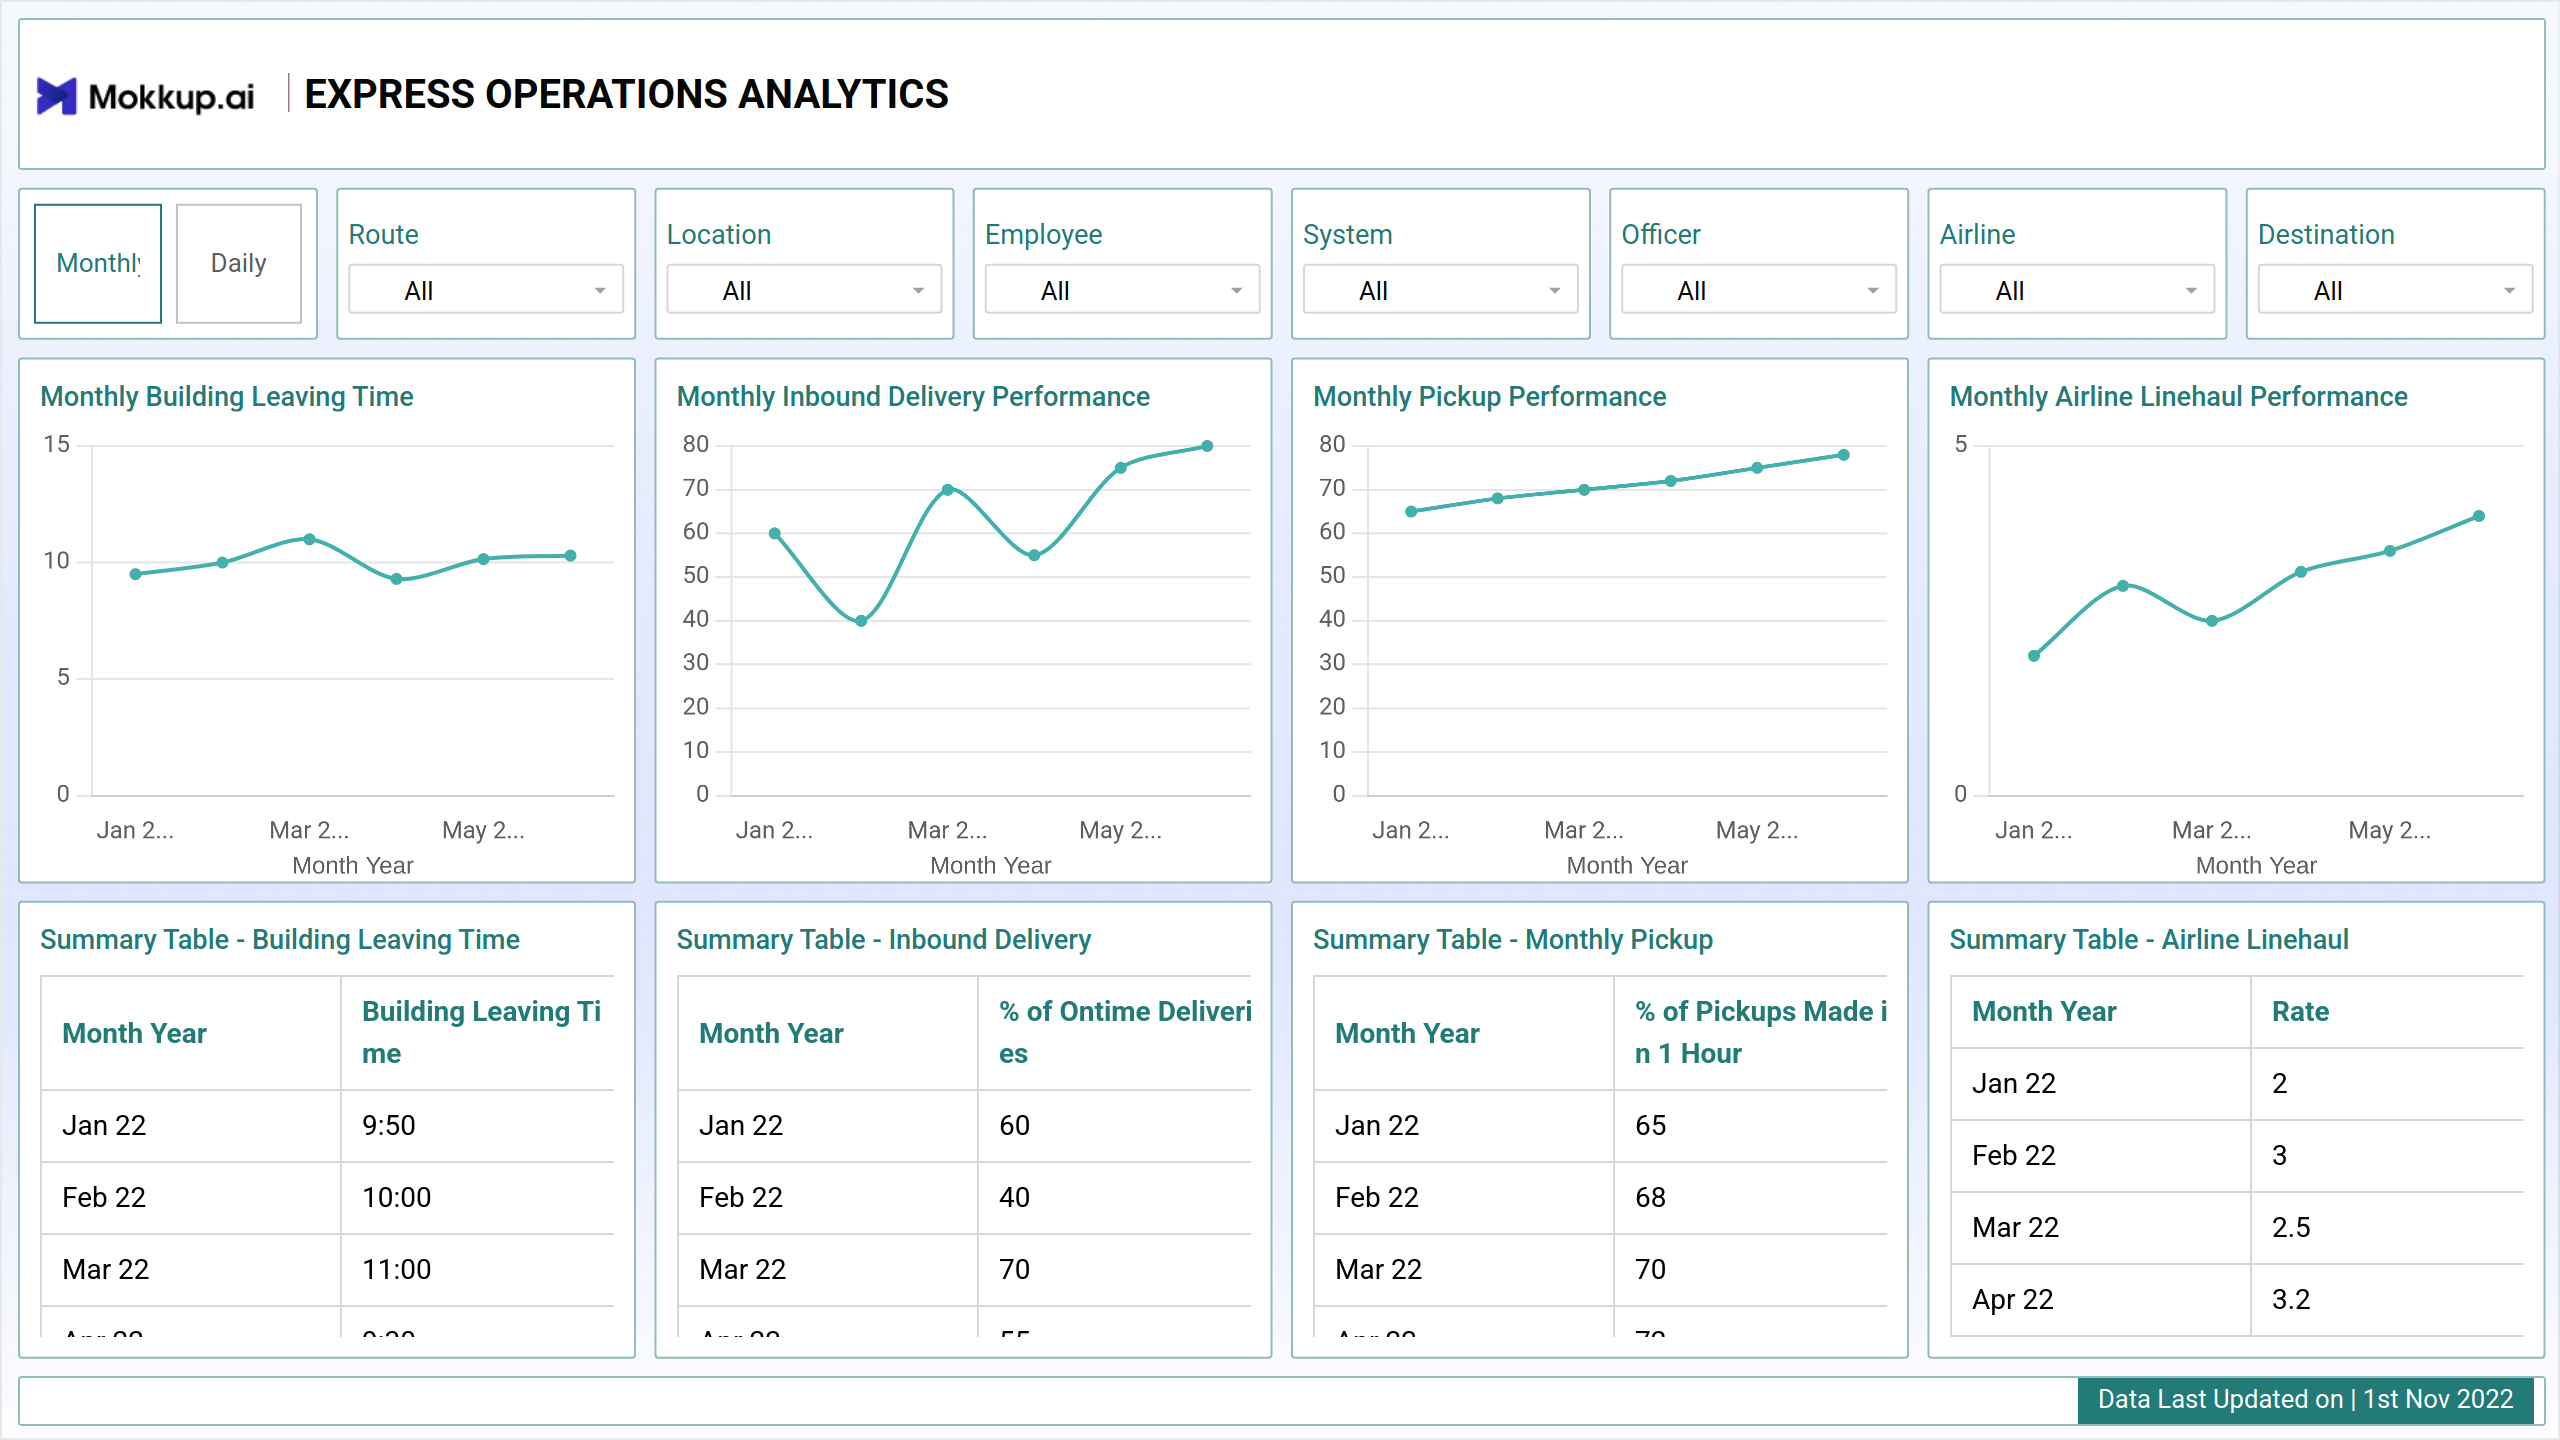
The Express Operations Analytics Dashboard template provides real-time information and analytics needed to assess a company's operational effectiveness. This dashboard is meant for organizations using express shipment services from shipping businesses.
It displays important data like package tracking, arrival times, and other analytics, helping organizations manage their express shipping operations and making crucial business decisions.
The dashboard wireframe showcases essential key metrics relevant to express shipping operations.
Key Terms to Know
- Monthly Building Leaving Time: Tracks the average time when shipments leave the warehouse or fulfillment center each month, providing insights into order processing efficiency and fulfillment timelines.
- Inbound Delivery Performance: Analyzes the performance of inbound shipments, measuring factors such as delivery accuracy, timeliness, and adherence to service level agreements (SLAs) for incoming packages.
- Pickup Performance: Monitors the performance of pickup services, assessing the timeliness and efficiency of scheduled pickups from customers or vendors.
- Airline Linehaul Performance: Evaluates the performance of airline linehaul operations, including metrics such as transit times, on-time departures, and delivery accuracy for shipments transported via air freight.
In addition, the dashboard offers a brief overview table that highlights important performance indicators like the rate metric, building leaving time, on-time delivery %, and pickup completion within an hour.
This summary makes it easier to evaluate operational effectiveness and makes it easier to optimize express shipping procedures for better results.
Express Operations Analytics - Screen 2
Screen 2 of the dashboard wireframe consists of crucial metrics related to inbound clearance performance and value-added services.
Key Terms to Know:
- Monthly Inbound On Arrival Clearance Performance: Tracks the percentage of total detained packages and the percentage of total on-arrival packages, providing insights into clearance efficiency and potential bottlenecks in the inbound process.
- Inbound Formal Clearance Performance: Helps in the supervision and administration of inbound shipment procedures by keeping track of the total number of shipments that are held and cleared during official clearance procedures.
- Value Added Services: It examines how value-added services like packaging, labeling, and special handling requirements are used and carried out throughout shipment handling.
The dashboard wireframe also includes summary tables for every measure, providing a thorough overview of performance trends and important metrics for value-added services and inbound clearance procedures.
Dashboard Template Insights
The dashboard wireframe provides valuable insights and tools for optimizing shipping processes and performance.
- It offers a comprehensive overview of a company's express shipping operations.
- Facilitates tracking of delivery times and packaging-related metrics.
- Enables data filtering based on various criteria, including timeframes, routes, locations, personnel, systems, airlines, and service types.
- Provides a robust platform for performance tracking, benchmarking, and the identification of areas for enhancement for making data driven decisions.
Conclusion
Organizations can make informed decisions, achieve increased efficiency and customer satisfaction in express shipping operations by streamlining operational workflows, improving value-added service offerings, and maximizing inbound clearance processes using real-time data and analytics.