What is an ENT Operations Dashboard?
An ENT Operations Dashboard is a digital tool developed for hospitals and surgical centers specializing in Ear, Nose, and Throat (ENT) services. This dashboard consolidates real-time data from multiple sources, providing a structured view of ENT surgical cases, resources, and operational efficiency. Medical administrators and surgeons use it to monitor and improve clinic performance, track operating room utilization, and optimize procedure schedule management.
How to Create an ENT Operations Dashboard
You don’t need to build your report from scratch; start with a ready-to-use dashboard template from Mokkup. Add in your data and export it however you like. Here’s how to do it:
1. Create or Log in to Your Mokkup Account
Start by signing up on Mokkup.ai using your email. If you already have an account, log in, and you’ll be ready.
2. Choose and Customize Your Dashboard Template
The ENT Operations Dashboard template is in the Templates section. Use the drag-and-drop editor to adjust KPIs, edit filters, or add elements based on your data.
3. Export to Your BI Tool
Once your dashboard wireframe is ready, use the BI Tool Export feature to send it directly to Power BI or Tableau for further analysis and enhancements. You can also download the dashboard as a PDF, PNG, or JPEG, embed it on a platform, or invite your team to collaborate.
Note: This is a Pro template. You’ll need a Pro subscription on Mokkup to use and customize this dashboard wireframe. Upgrade anytime to unlock full access.
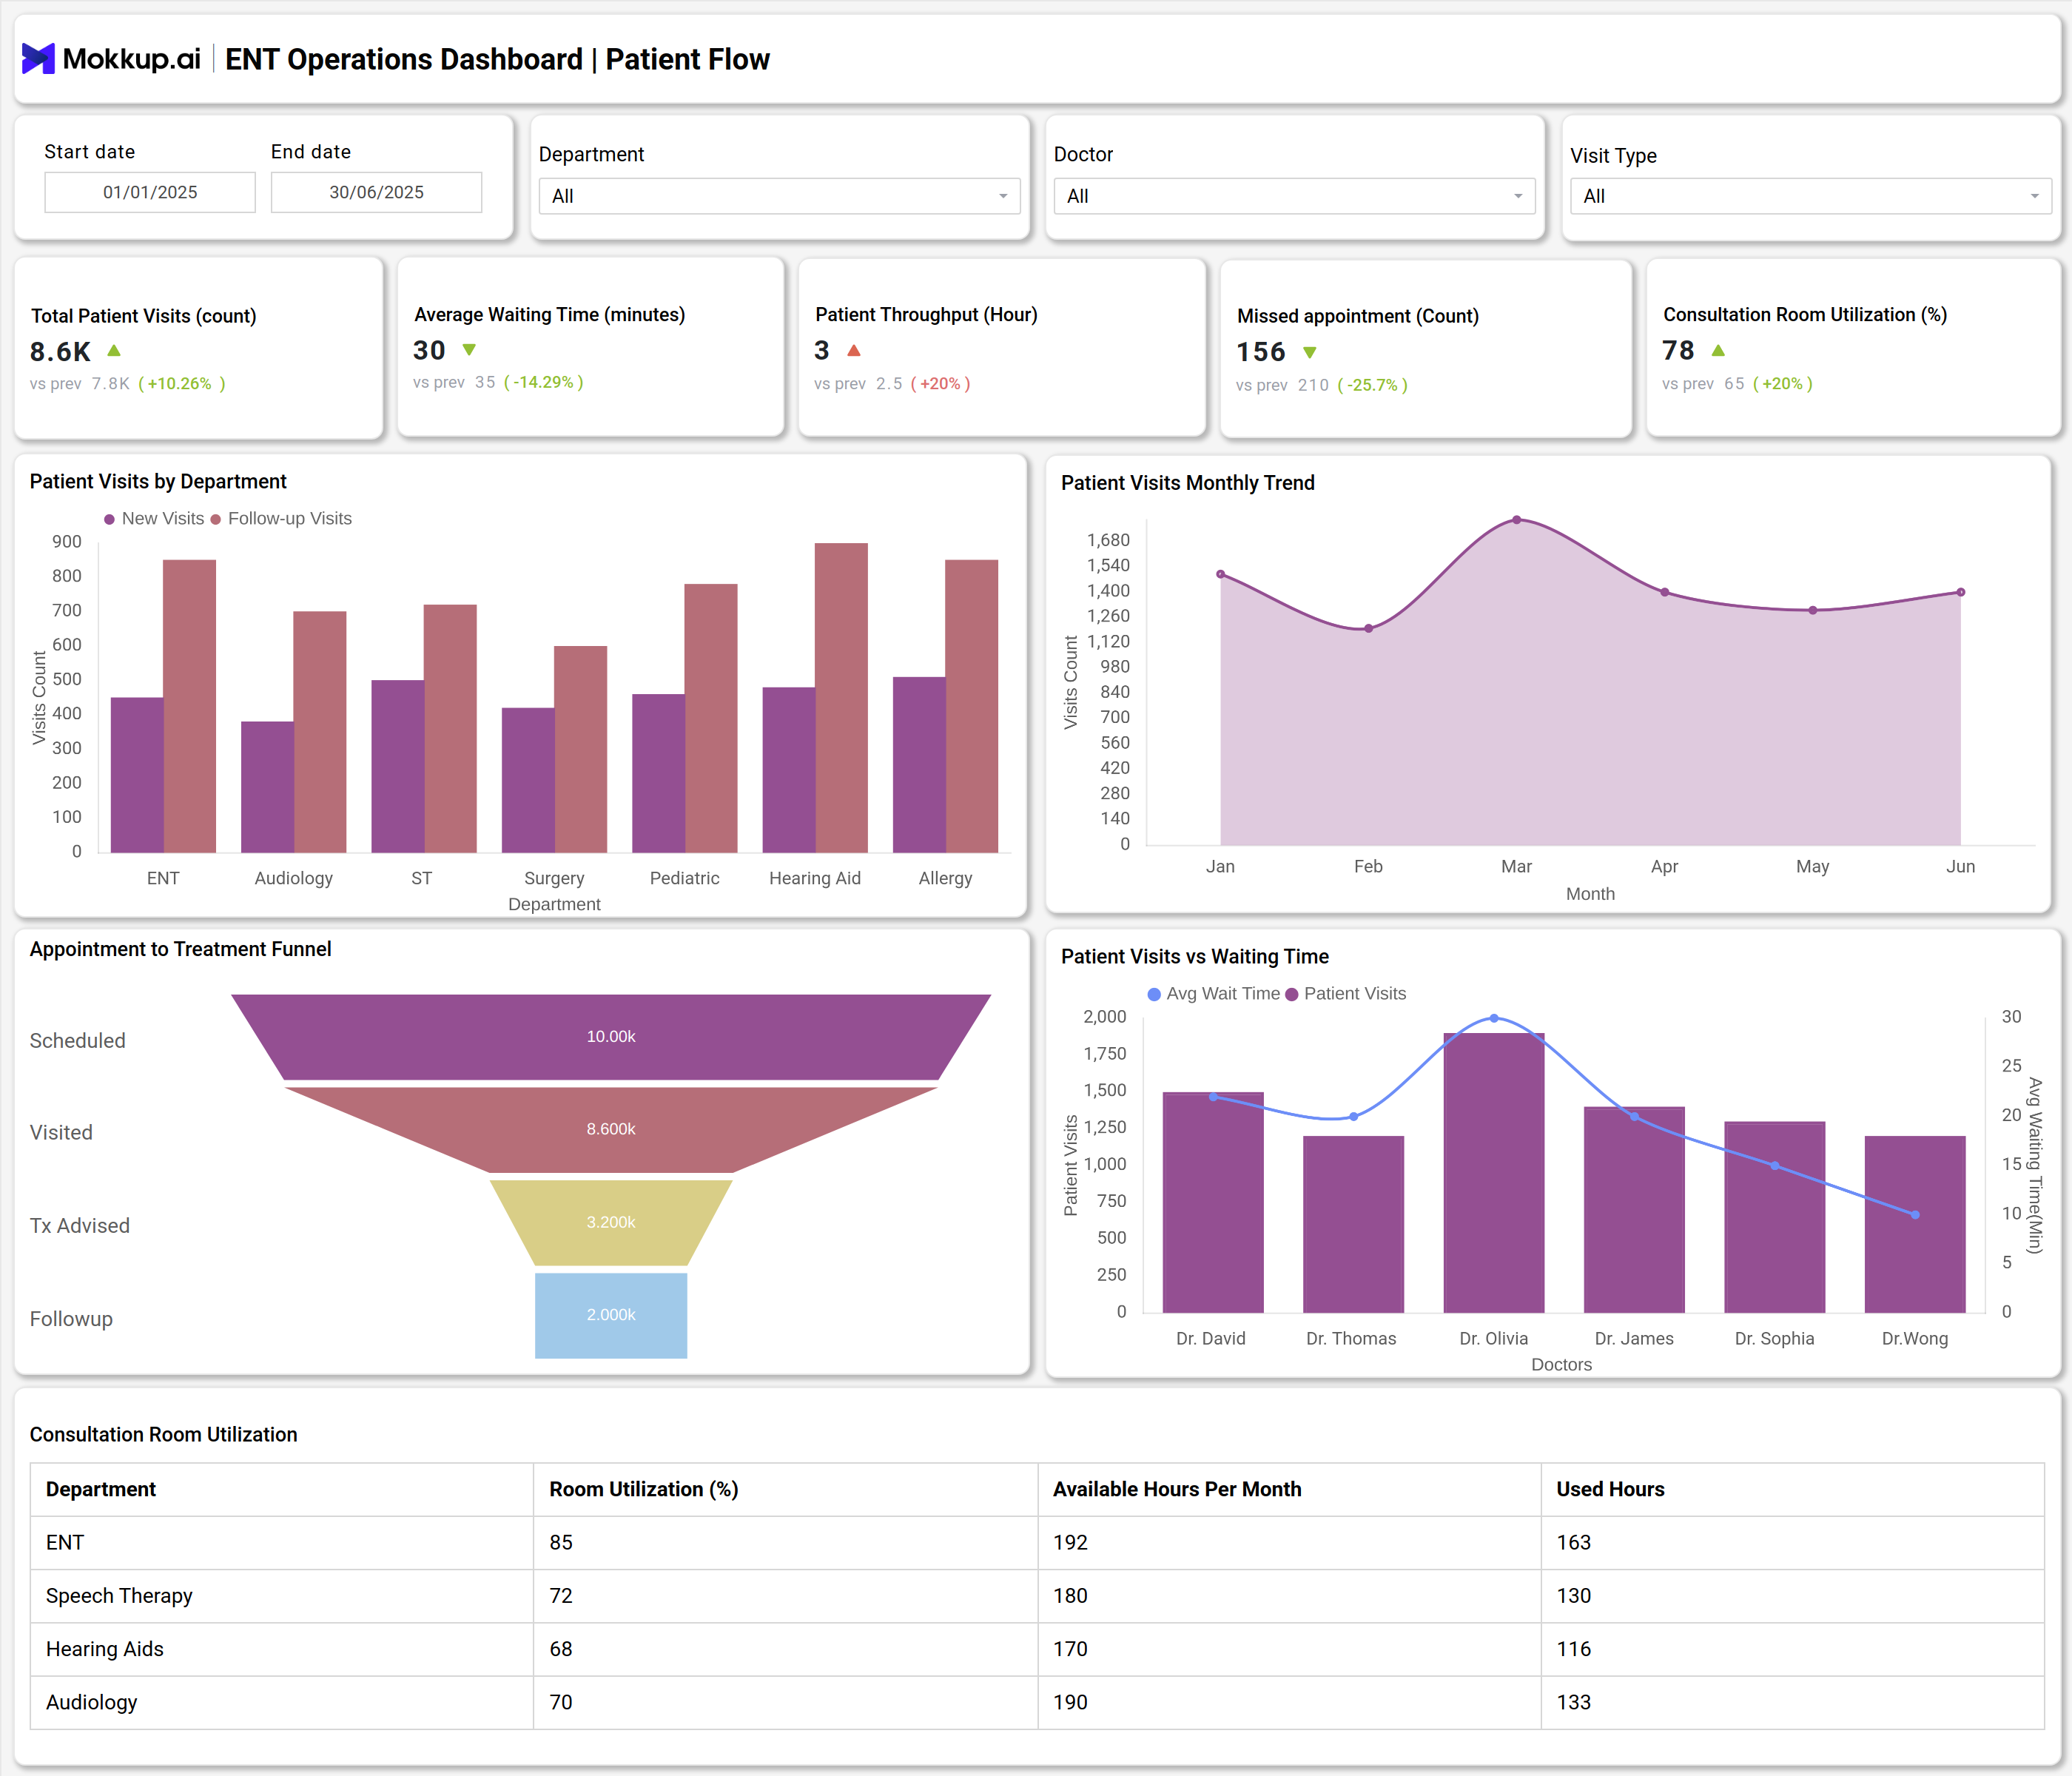
ENT Operations Dashboard Example
An effective ENT Operations Dashboard captures a wide array of performance metrics, including surgical case volumes, ENT operating room utilization, and category-wise procedure analysis. Modern dashboards illustrate trends in operating room efficiency through visualizations such as line charts for monthly OT utilization, bar graphs for equipment downtime, and occupancy analysis of ENT inpatient units. For example, dashboards display equipment utilization rates, maintenance compliance, and energy usage linked to specific ENT equipment. These features enable hospital teams to identify and address inefficiencies, such as delays in case initiation or high rates of surgical cancellations, ensuring that patient throughput and scheduling are continually improved for optimal patient outcomes.
How to Analyze Data in ENT Operations Dashboards
To make the most of the dashboard, users should follow a structured approach to data analysis:
- Review the Ear, Nose, and Throat procedure metrics for monthly variations and standard procedure types.
- Track operating room efficiency by monitoring OT utilization rates and equipment downtime.
- Assess trends in surgical case volumes, ENT, by comparing current and historical case numbers.
- Analyze scheduling data for patterns related to start delays and cancellations.
- Use category analysis to evaluate intraoperative and postoperative durations for each procedure type.
- Investigate bed and equipment occupancy to ensure resource availability and anticipate bottlenecks.
- Compare maintenance compliance and energy consumption data to promote sustainable operations.
Benefits of ENT Operations Dashboards
Using an ENT operations dashboard provides multiple operational and financial advantages:
- Improve ENT operating room efficiency with accurate, real-time performance monitoring.
- Reduce case start delays ENT through optimized scheduling and workflow management.
- Identify intraoperative and postoperative durations to streamline throughput and enhance patient care.
- Lower the rate of case cancellations in ENT surgery by monitoring contributing factors.
- Enable data-driven management of ENT procedure category analysis for precise resource allocation.
- Support better decision-making with clear visualizations of surgical case volumes and resource usage.
KPIs to Track in ENT Operations Dashboards
Some key performance indicators (KPIs) every hospital should monitor include:
- Ear, Nose, and Throat procedure metrics: Track the volume, type, and complexity of ENT surgeries.
- Surgical case volumes ENT: Monitor total cases performed, scheduled, and canceled.
- OR utilization ENT surgery: Measure the percentage of time operating theaters are used for ENT cases.
- ENT procedure category analysis: Assess the distribution of surgeries across procedure types.
- Case start delays ENT: Record and address causes for delayed operating room starts.
- Intraoperative and postoperative durations ENT: Track average case times and recovery periods.
Frequently Asked Questions
1. Who uses an ENT Operations Dashboard?
Hospital administrators, clinical managers, and ENT surgeons rely on this dashboard to manage resources and improve surgical outcomes.
2. What are the top metrics tracked in ENT Operations Dashboards?
Key metrics include operating room efficiency, ENT procedure volumes, equipment utilization rates, and case start delays.
3. How does an ENT Operations Dashboard reduce case cancellations?
Monitoring cancellation trends, identifying root causes, and enabling corrective actions through data insights.