
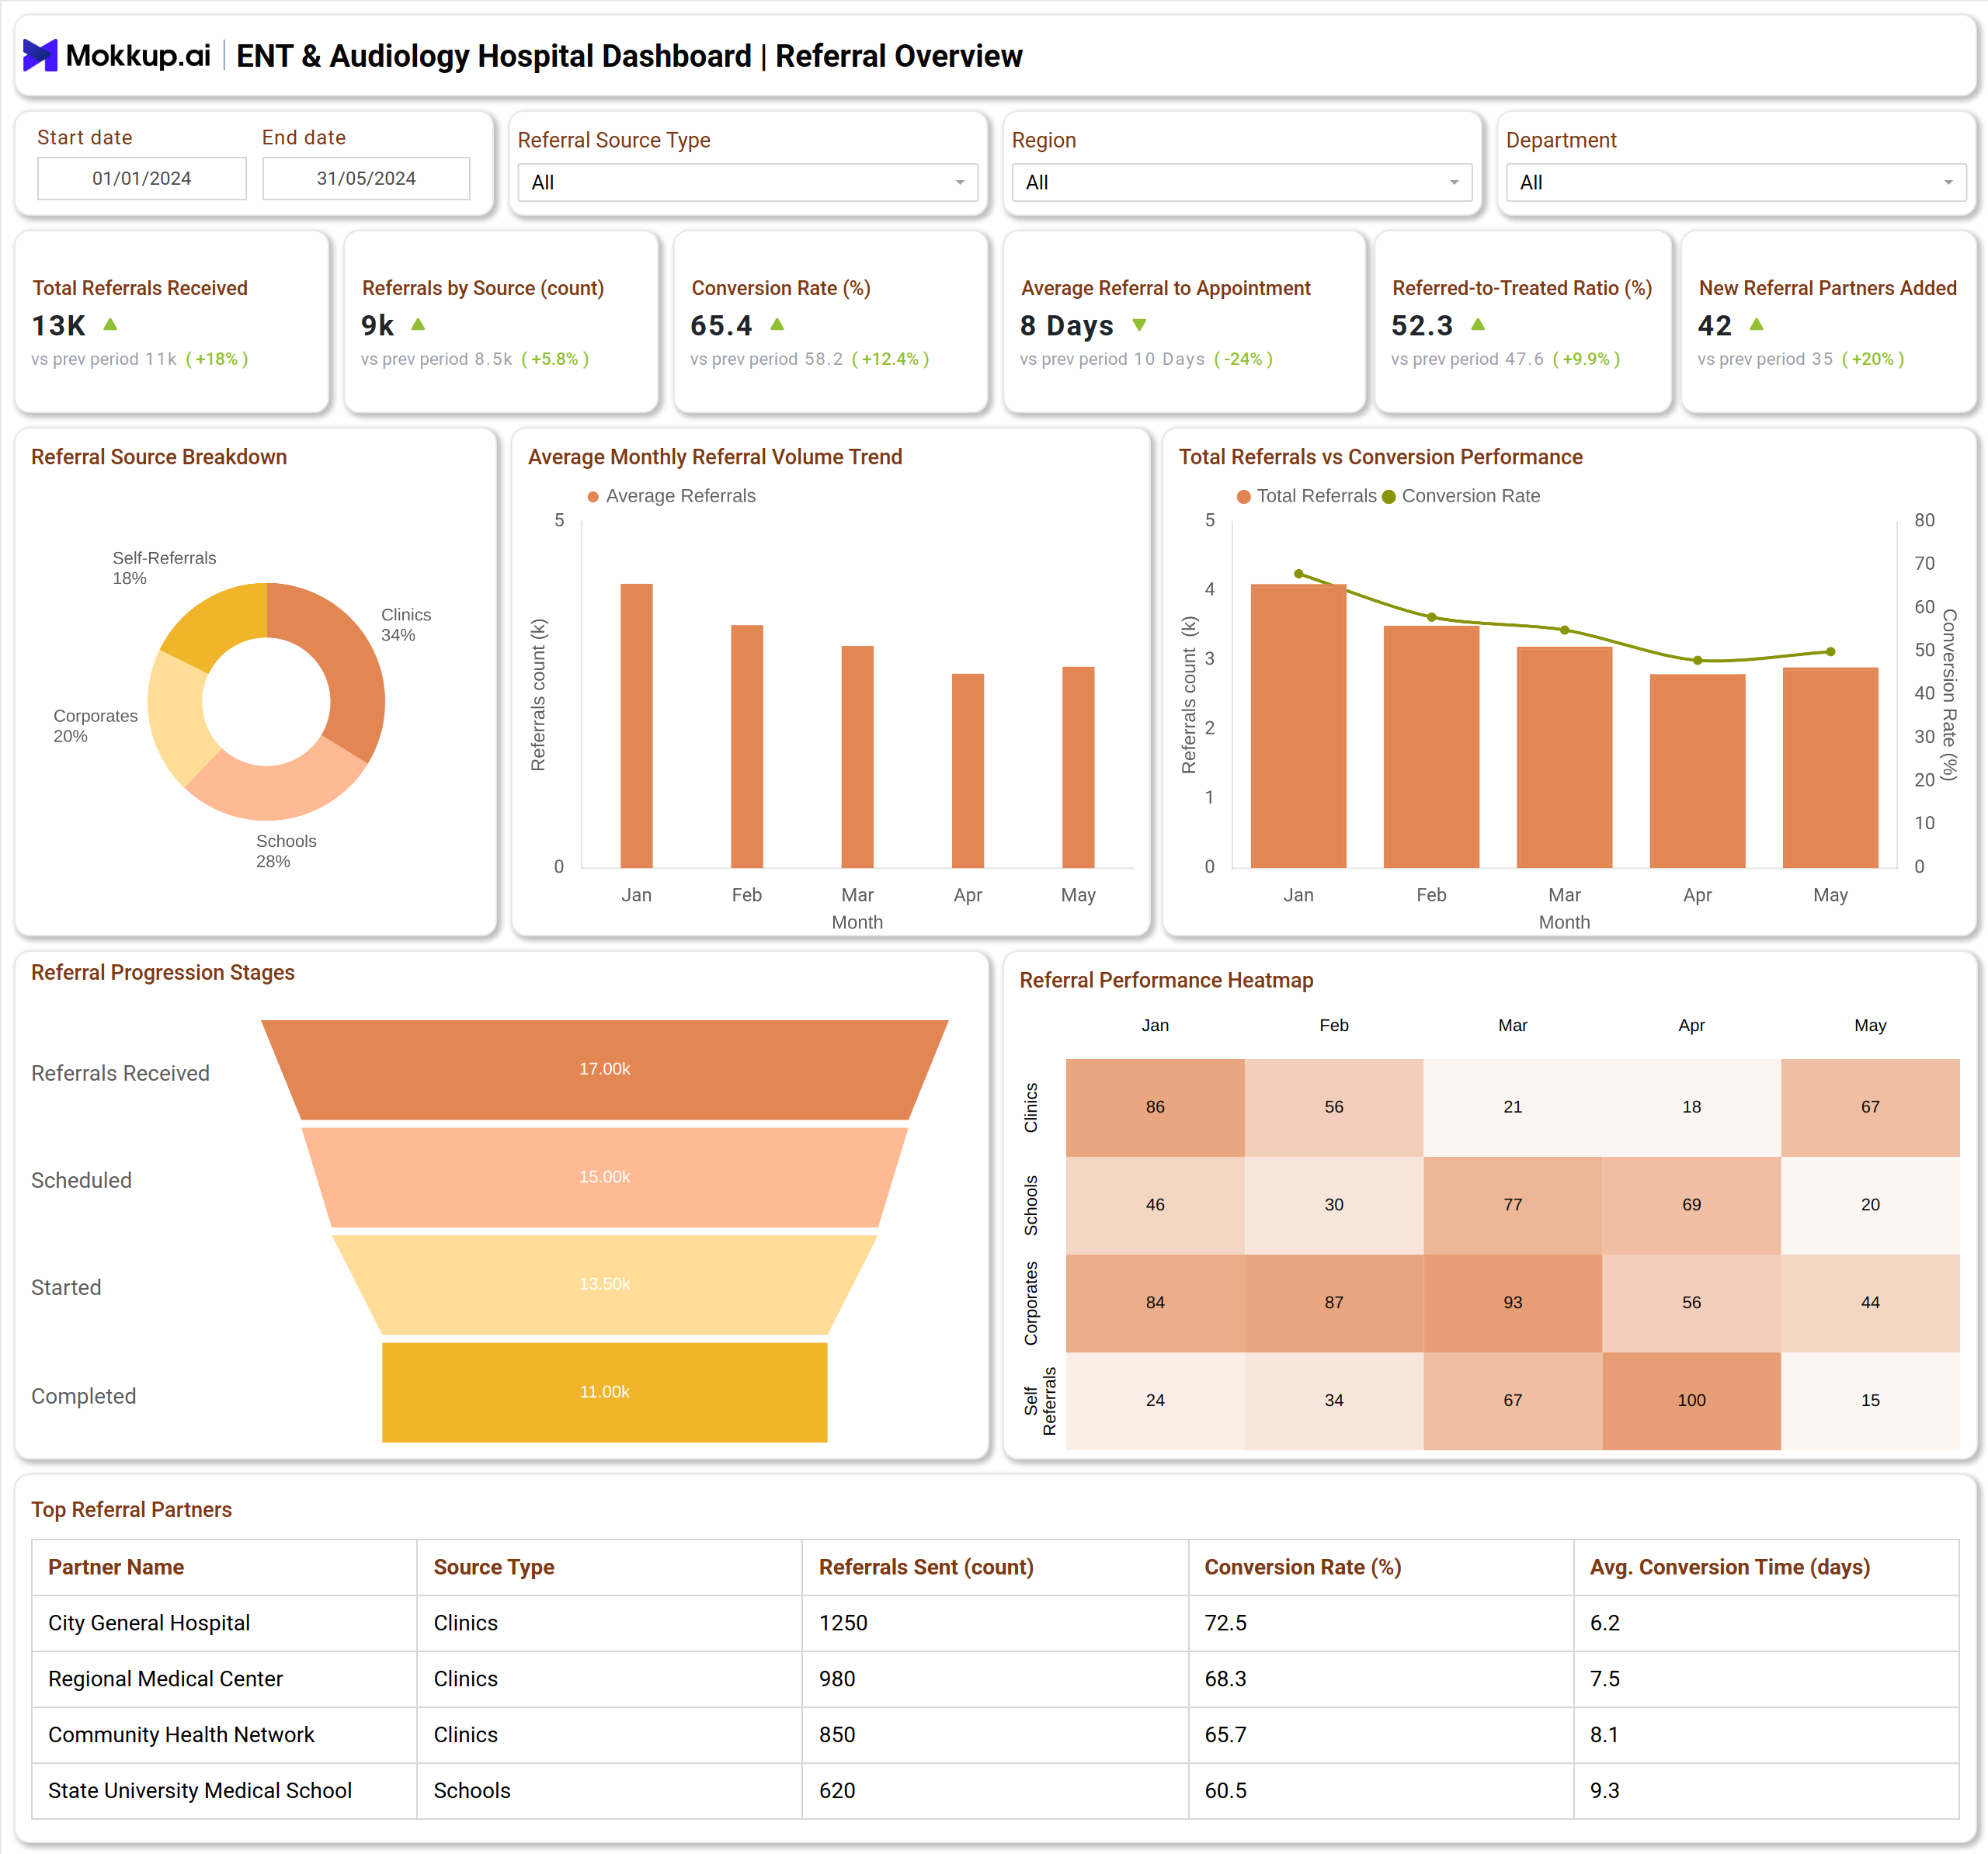
What is an ENT & Audiology Hospital Referral & Network Dashboard?
The ENT & Audiology Hospital Referral & Network Dashboard is a specialized healthcare analytics solution designed to monitor patient referral performance, branch growth, and network efficiency across clinics, hospitals, and outreach centers. This dashboard template integrates key metrics related to referral conversion rate, patient acquisition, network expansion, and branch performance, helping hospital administrators to make data-driven decisions that enhance referral-to-treatment efficiency.
The ENT and Audiology referral dashboard wireframe tracks the entire referral journey, from initial contact to treatment completion, providing complete visibility into hospital referral trends, partner effectiveness, and branch-level performance. It bridges operational, marketing, and clinical data to strengthen referral pathways and optimize network productivity.
How to Create ENT & Audiology Hospital Referral Dashboards
You don’t need to build your report from scratch—just start with a ready-to-use sample ENT & Audiology Hospital Dashboard template from Mokkup. Plug in your own data and export it however you like. Here’s how to do it:
1. Create or Log in to Your Mokkup Account
Start by signing up on Mokkup.ai using your email. Already have an account? Just log in, and you’re good to go.
2. Choose and Customize Your Dashboard Template
Find the ENT & Audiology Hospital Dashboard template in the Templates section. Use the drag-and-drop editor to adjust KPIs, edit filters, or add elements based on your data.
3. Export to Your BI Tool
Once your dashboard is ready, use the BI Tool Export feature to send it directly to Power BI or Tableau for further analysis and enhancements. You can also download the dashboard as a PDF, PNG, or JPEG, embed it on a platform, or invite your team to collaborate.
Note: This is a Pro template. To use and customize this dashboard wireframe, you’ll need a Pro subscription on Mokkup. Upgrade anytime to unlock full access.
ENT & Audiology Hospital Referral Dashboard Example
The ENT & Audiology Hospital Referral Dashboard Example offers a clear view of referral activity and network performance. It tracks key KPIs like Total Referrals (13K), Conversion Rate (65.4%), and Referral-to-Treated Ratio (52.3%), while visuals such as the Referral Funnel, Heatmap, and Top Referral Partners Table help identify bottlenecks, monitor source reliability, and recognize high-performing partners.
The Network & Branch Analysis section highlights Branch Conversion Rate (67.5%), Network Growth Rate (22.6%), and Average Patients per Branch (1,245) to assess regional efficiency. With tools like the Geographic Map and Growth Trend Chart, hospital leaders can track expansion, improve outreach, and enhance patient inflow across ENT and audiology units.
How to Analyze Data in ENT & Audiology Referral Dashboards
When using the ENT & Audiology Referral & Network Dashboard, key analysis points include:
- Referral-to-Conversion Tracking: Evaluate the ratio of referred to treated patients for operational efficiency.
- Source Effectiveness: Identify which sources—schools, clinics, or corporates—generate the highest conversion rates.
- Network Growth Trends: Monitor the expansion of referral centers and outreach regions.
- Branch Performance Correlation: Measure patient inflow, conversion rates, and revenue contribution by branch.
- Partner Evaluation: Assess top-performing referral partners to strengthen collaboration strategies.
These analytics collectively improve patient acquisition, referral retention, and operational throughput.
Benefits of ENT & Audiology Hospital Referral & Network Dashboard
The ENT & Audiology Hospital Dashboard ensures efficient referral workflows and sustainable patient growth across all connected centers:
- Streamlined Referral Management: Simplifies tracking across multiple referral channels.
- Improved Conversion Visibility: Monitors performance from referral receipt to treatment completion.
- Enhanced Partner Collaboration: Identifies top contributors for improved relationship management.
- Optimized Branch Operations: Offers clear insights into branch-level efficiency and outreach performance.
- Data-Driven Growth Strategy: Supports strategic decision-making for network expansion and revenue optimization.
KPIs to Track in ENT & Audiology Hospital Referral Dashboards
These KPIs help hospitals measure referral efficiency, network performance, and patient conversion trends:
- Total Referrals Received (Count): Tracks the overall volume of patient referrals across all sources.
- Referral Conversion Rate (%): Measures the percentage of referred patients who proceed with treatment.
- Referral-to-Treated Ratio (%): Evaluates the effectiveness of converting referrals into active cases.
- Average Conversion Time (Days): Indicates how long it takes for a referral to turn into a completed treatment.
- Branch Conversion Rate (%): Compares conversion performance across hospital branches or clinics.
- Network Growth Rate (%): Monitors the expansion of referral partners and new network additions.
- Regional Outreach Coverage (%): Assesses how effectively the hospital reaches and engages patients across regions.
Monitoring these KPIs ensures strong referral networks, improved conversion performance, and better patient access management.
Frequently Asked Questions (FAQs)
Q1. What is an ENT & Audiology Hospital Referral Dashboard used for?
It tracks referral sources, conversion performance, and network growth to optimize patient acquisition and operational efficiency.
Q2. Who uses this dashboard?
Hospital management, network coordinators, and ENT or audiology department heads use it to monitor partner and branch performance.
Q3. How does this dashboard help improve referral performance?
By visualizing referral patterns, conversion timelines, and network gaps, it helps identify high-performing sources and areas that need targeted engagement.