
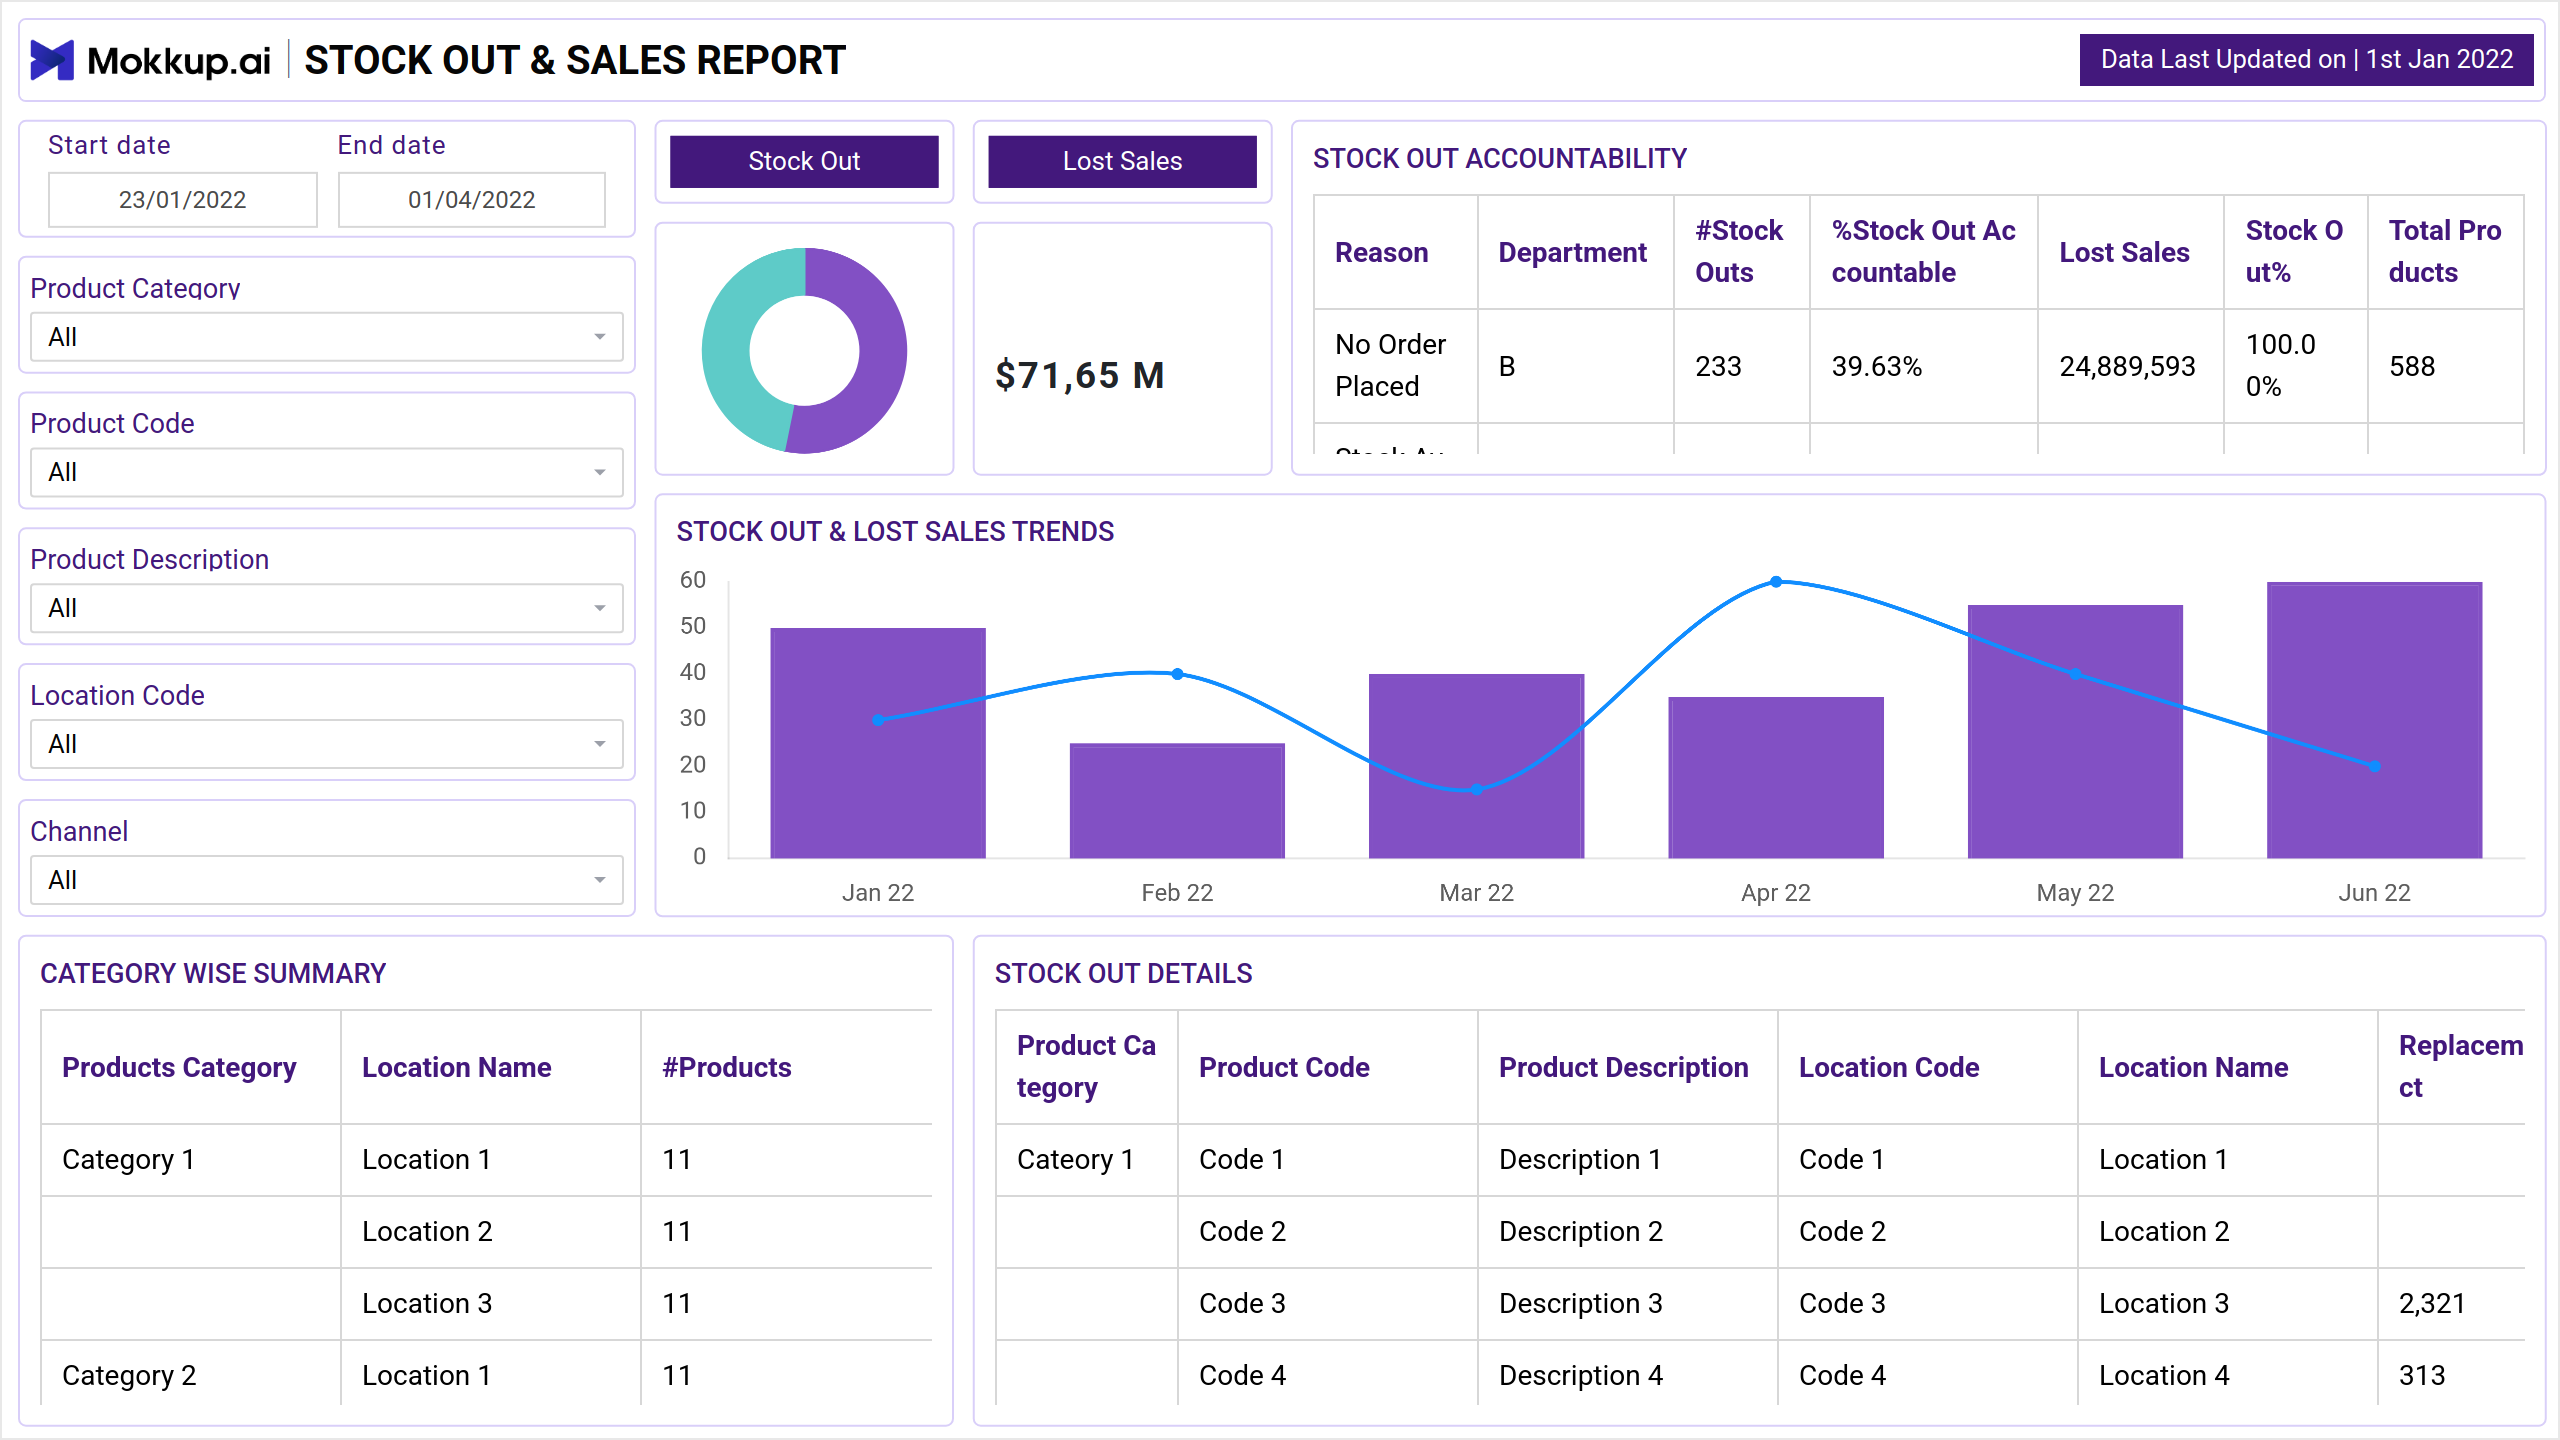
A Stockout Report dashboard template provides information about the inventory levels and product sales at a given time period. The report helps organizations make informed decisions about inventory management and improve sales performance.
The Stockout Report includes the following information discussed below.
- Stockout: It displays the quantity of items or products that are out of stock. Stockout helps in keeping track of the availability of stock for the customers.
- Lost Sales: The potential revenue lost due to the shortage of stock. Lost sales occur when a company runs out of a product that a customer wants to buy. The customer either purchases the product from a competitor or decides not to buy it at all.
- Stock Movements: This displays the flow of products from suppliers to customers. It helps in optimizing the inventory levels and the overall flow.
- Sales by Product: The report includes information about individual product sales, which can assist organizations in making informed decisions about sales volumes and allotment.
Key Terms to Know:
- Lost Sales KPIs: The lost sales key performance indicators (KPI) indicate the loss of potential revenue due to the shortage of product supply.
- Stock Out Accountability: The stockout accountability table provides an overview of the inventory availability of different products.
- Stock Out and Lost Sales Trends: A Stock Out and Lost Sales Trends chart visually represents the frequency and severity of stockouts when a product is out of stock.
- Category Wise Summary: The category-wise summary table displays the contribution of a specific product or item in the sales, the lost sales, and the stock out percentage.
- Stock Out Details: The stock out details table indicates the different data values such as the product replacement values, average sales value, lost sales, etc.
Dashboard Template Insights
The dashboard wireframe offers key insights to help businesses manage inventory and improve sales performance:
- It provides visibility into inventory levels, enabling organizations to track stockouts and ensure optimal stock availability for customers.
- Insights into lost sales highlight the potential revenue loss from stock shortages, underscoring the importance of maintaining adequate inventory to meet demand and prevent revenue loss.
- The analysis of stock movements allows businesses to optimize inventory levels and streamline product flow, reducing stockouts and improving operational efficiency.
- Detailed sales performance insights by product help organizations make informed decisions on sales volumes, allocation, and product assortment, ultimately enhancing profitability.
Conclusion
The Stock Out Report dashboard template provides a visual overview of stock-out data, including the number of stock outs, the value of stock outs, the products that are most often out of stock, and the reasons for stock outs. This information can be used to track stock out trends, identify areas for improvement, and make informed decisions about inventory management.