A Sales and Customer Service Analytics dashboard template aggregates critical metrics related to sales performance and customer service effectiveness. The wireframe provides a comprehensive overview of key performance indicators (KPIs), helping businesses track and improve their sales processes and customer service operations.
Key Terms to Know
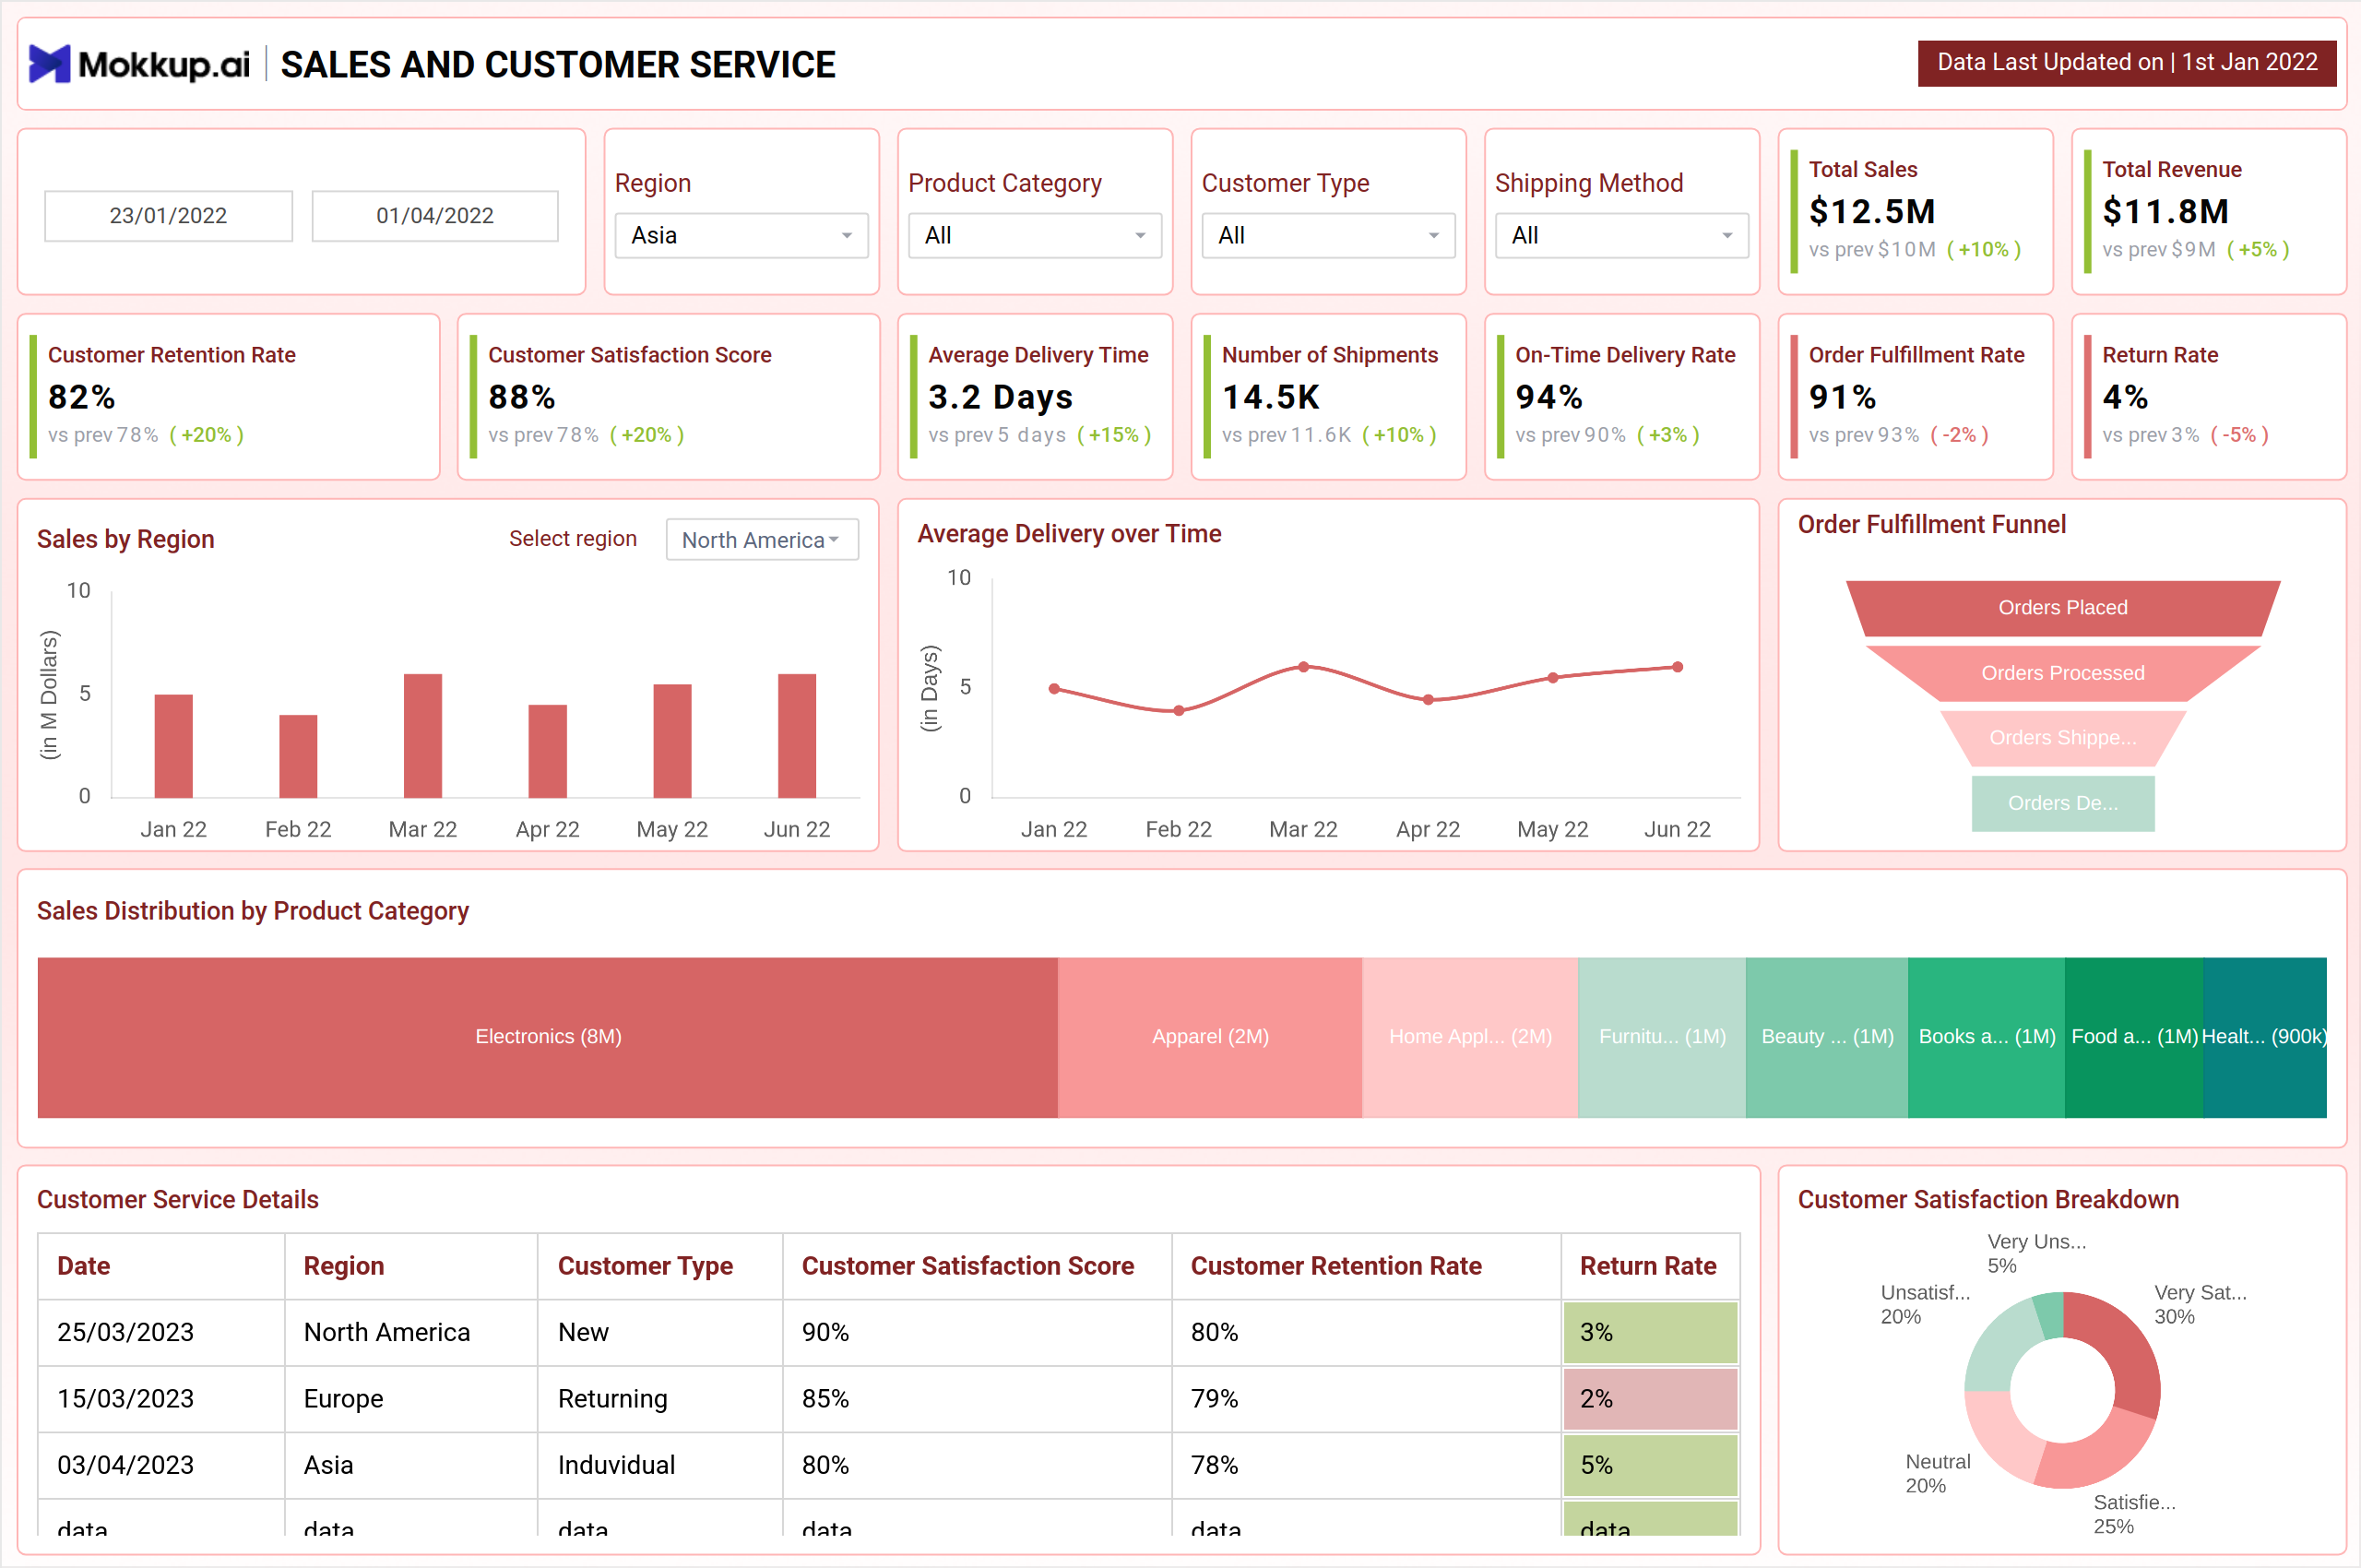
- Customer Retention Rate: Measures the percentage of customers who continue to do business with the company over a specific period.
- Customer Satisfaction Score (CSAT): This score gauges customer satisfaction based on feedback or surveys.
- Average Delivery Time: Tracks the average time taken to deliver products to customers.
- Number of Shipments: This tracks the total number of shipments made within a specific period.
- On-Time Delivery Rate: Measures the percentage of deliveries made on or before the promised delivery date.
- Order Fulfillment Rate: This KPI monitors the percentage of orders successfully processed and delivered.
- Return Rate: Measures the percentage of products returned by customers.
- Sales by Region: This chart provides a visual representation of sales performance across different regions. It helps businesses identify high-performing areas and regions that may require more focus or improvement.
- Average Delivery Over Time: Tracks the average delivery time over a specified period, helping businesses monitor trends and improve their delivery processes.
- Order Fulfillment Funnel: Visualizes the order fulfillment process, from order receipt to delivery. It highlights potential bottlenecks and areas for improvement within the fulfillment process.
- Sales Distribution by Product Category: Displays sales data by product category, allowing businesses to identify popular products and categories that drive revenue.
- Customer Service Details: This table provides detailed information on customer service metrics, segmented by region, customer type, customer satisfaction score, customer retention rate, and return rate. It helps businesses analyze and improve customer service performance across different segments.
- Customer Satisfaction Breakdown: This chart offers a visual breakdown of customer satisfaction levels, providing a quick overview of customer sentiment.
Dashboard Template Insights
Here are the key takeaways of a Sales and Customer Service Analytics dashboard wireframe:
- It combines sales and customer service statistics to provide a holistic view of business success.
- Aggregated data presented in an understandable format helps firms to easily discover trends, identify possible concerns, and make data-driven decisions.
- Insights provide focused marketing efforts, efficient resource allocation, and attainable sales and service targets.
- Efficient use of data improves strategy, boosts customer satisfaction, and promotes loyalty, resulting in greater revenue and sustainable growth.
Conclusion
A Sales and Customer Service Analytics dashboard template allows businesses to gain a comprehensive view of their sales performance and customer service effectiveness. By tracking key metrics and visualizing data through various charts and tables, businesses can identify trends, uncover areas for improvement, and make informed decisions to boost customer satisfaction and drive growth.