
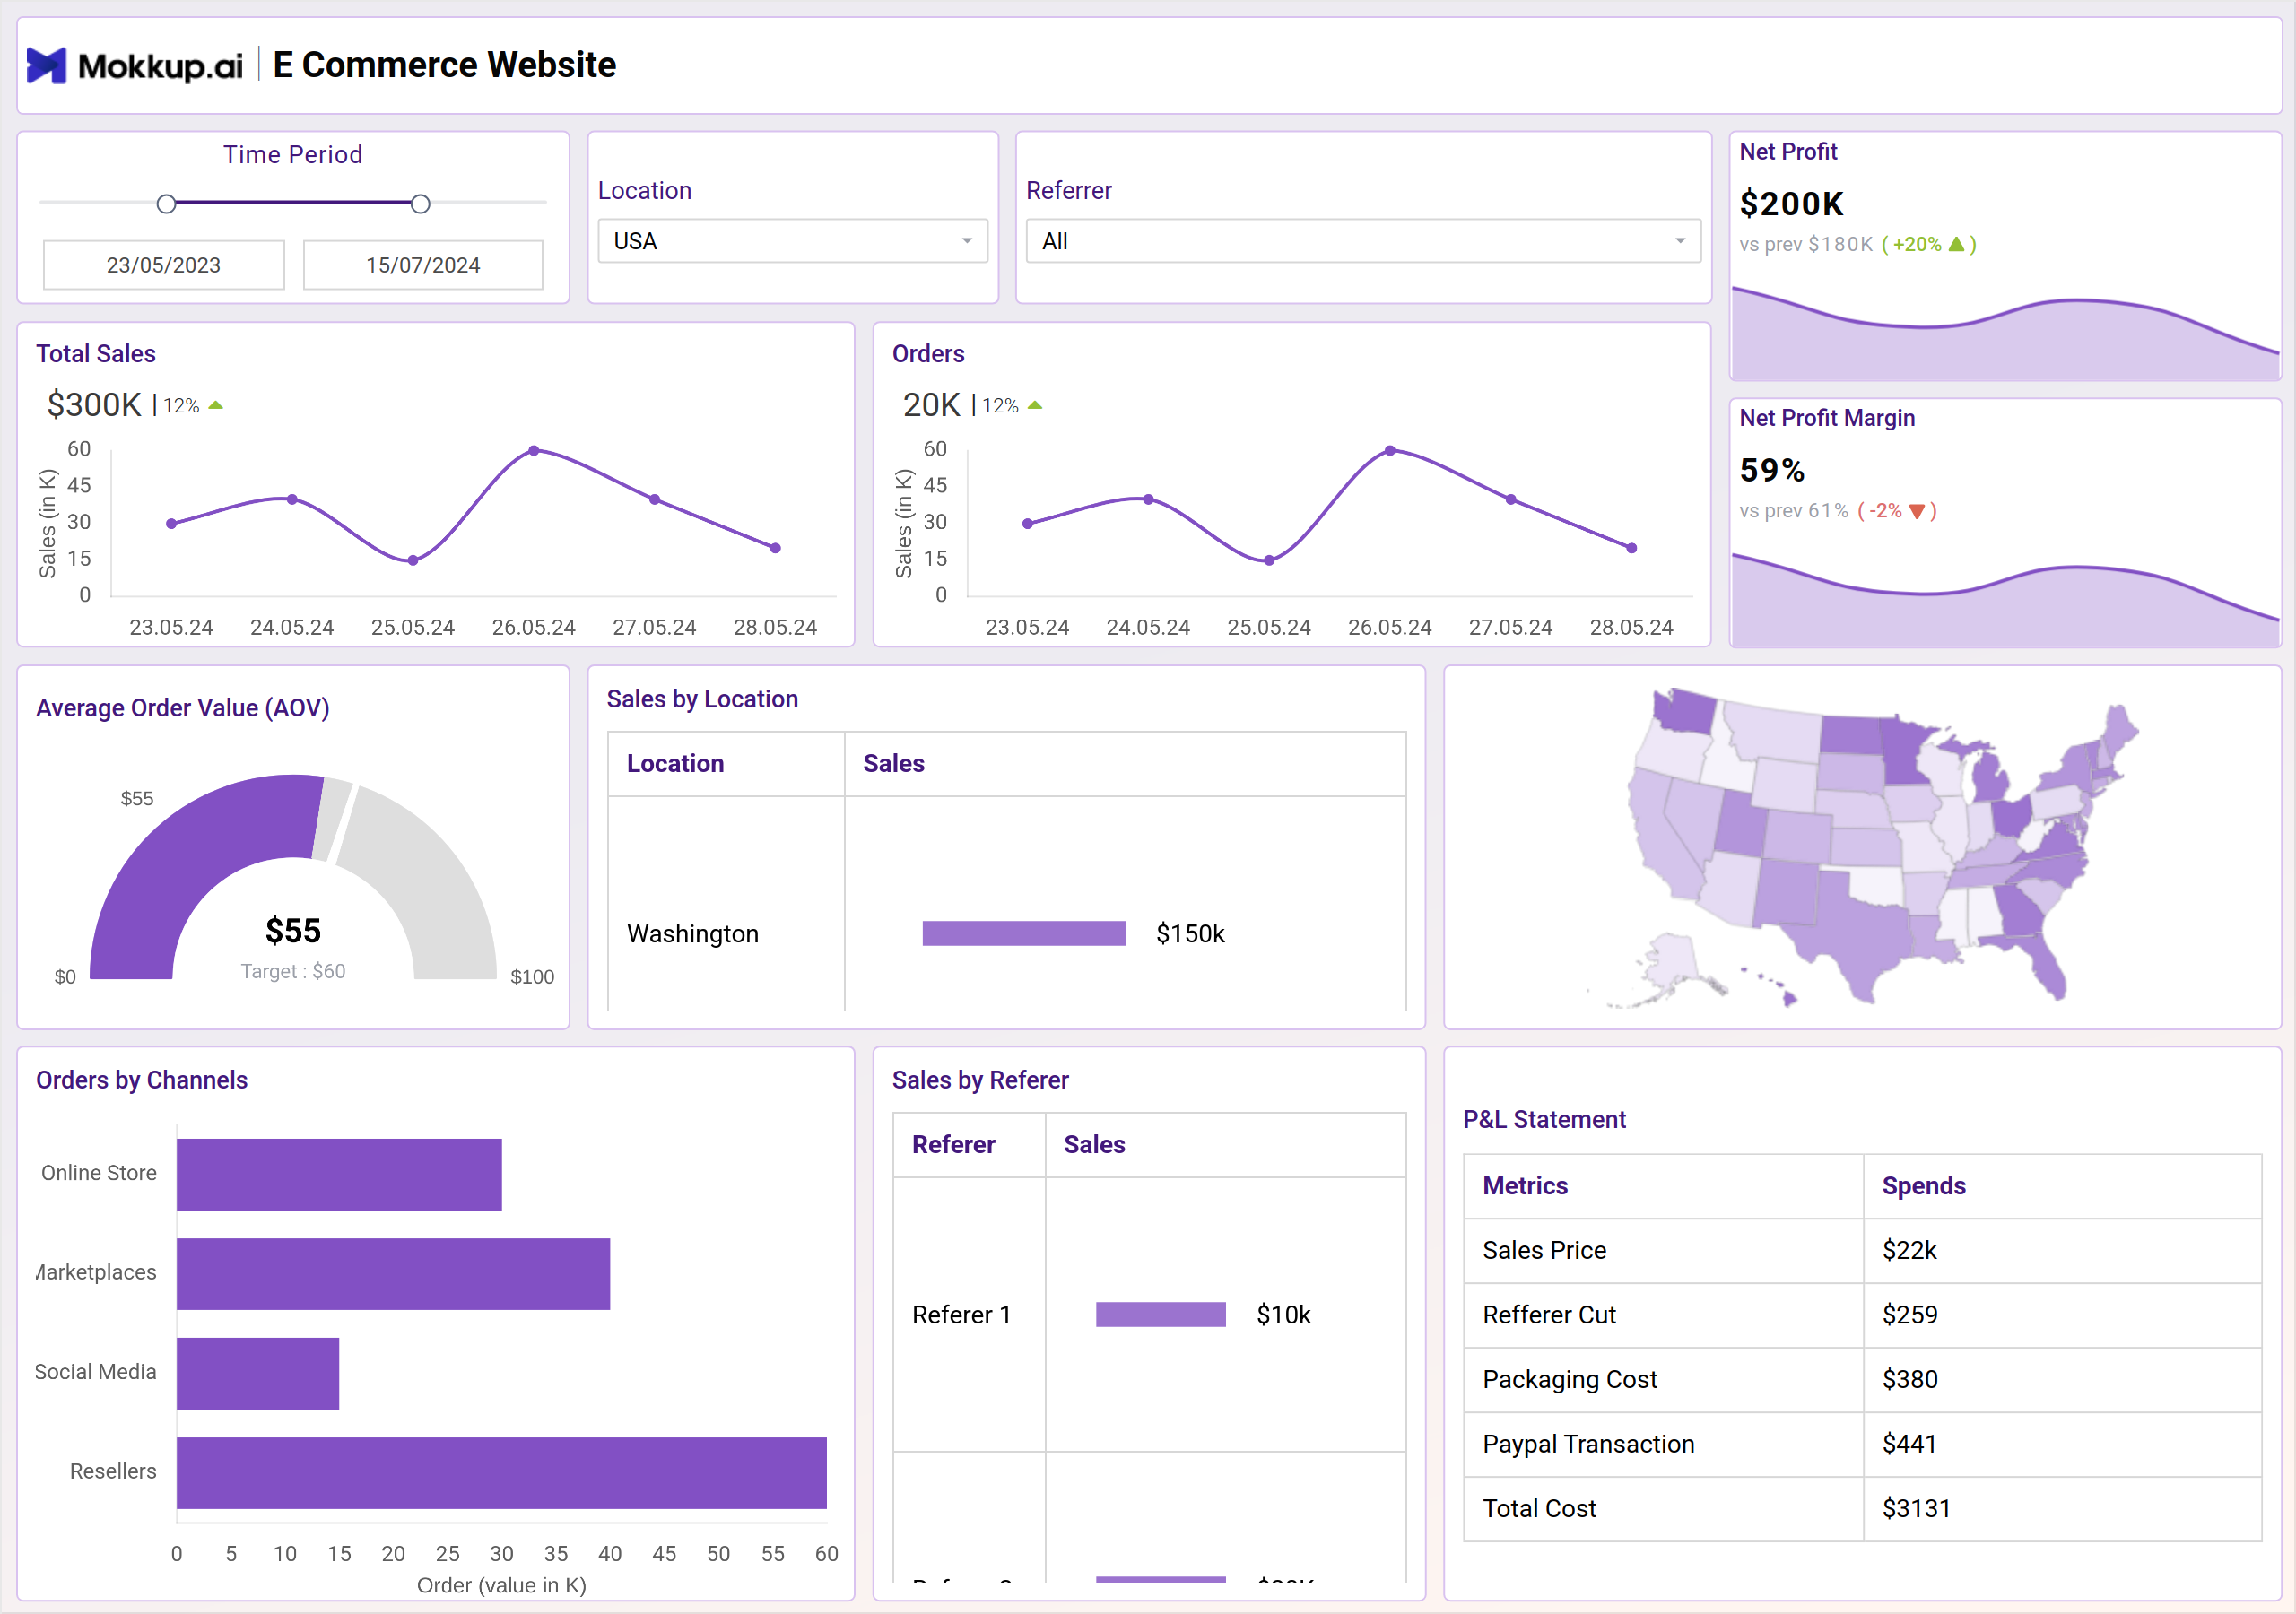
The E-commerce website dashboard template is a comprehensive platform for visualizing sales data and customer behavior. This dashboard presents key metrics such as revenue, conversion rates, and customer demographics in a clear, concise format. With its user-friendly design, it empowers business owners and marketers to quickly assess performance, identify trends, and make data-driven decisions to enhance their online store's success.
The dashboard wireframe comprises four screens: Overview, Marketing, Warehouse & Inventory; each is explained briefly below.
Overview
This screen provides a glance at key metrics for running a successful online store. This dashboard tracks performance across sales, orders, net profit, and average order value. It allows you to analyze trends over a chosen time period. The dashboard also provides a breakdown of sales by location and referrer, giving you insights into customer acquisition and geographic reach.
Key Terms to Know
- Total Sales: Displays the total revenue generated from sales.
- Orders: Shows the total number of orders placed.
- Net Profit: Indicates the total profit after deducting expenses.
- Net Profit Margin: Measures the profitability percentage of total sales.
- Average Order Value (AOV): Calculates the average amount spent per order.
- Sales by Location: Breaks down sales figures by geographical location.
- Order by Channels: Displays the number of orders from different sales channels.
- Sales by Referer: Shows the revenue generated from various referral sources.
- P&L Statement: Provides an overview of the profit and loss statement.
Marketing
This view is designed to provide a quick overview of your online store's marketing performance. See key metrics at a glance, including ad spend, website sessions, and customer acquisition cost. The dashboard breaks down website sessions by traffic source, such as organic traffic, social media, and email marketing. Track the return on investment (ROI) of your marketing campaigns to see which channels are driving the most sales.
Key Terms to Know
- Ad Spend This Week: Displays the total amount spent on advertising during the current week.
- Website Sessions: Indicates the total number of visits to the website.
- Order by Medium: Breaks down the number of orders by different marketing mediums.
- Retention Rate: Measures the percentage of returning customers.
- Customer Feedback: Summarizes the feedback and reviews received from customers.
- Promotion Effectiveness: Evaluates the success of promotional campaigns.
Warehouse
This screen provides an instant snapshot of key performance indicators (KPIs), including order fulfillment rates, unfulfilled orders, and after-fulfillment times. Track inventory levels across various categories and identify potential stockouts to ensure smooth operations. It also helps e-commerce businesses optimize their fulfillment processes, reduce wait times, and streamline overall warehouse operations for better customer satisfaction.
Key Terms to Know
- Orders: Displays the total number of orders placed.
- Revenue: Shows the total income generated from sales.
- Unfulfilled Orders: Indicates the number of orders yet to be fulfilled.
- Returns: Measures the total number of returned orders.
- Orders Today: Displays the number of orders placed today.
- Orders This Month: Shows the total number of orders placed this month.
- After Fulfillment Time: Measures the time taken to fulfill orders after they have been placed.
Inventory
The view provides an overview of key inventory metrics, including total inventory value, warehouse capacity utilization, and the number of non-moving products. It also highlights potential stock shortfalls and surpluses for fast-moving products. By analyzing this data, e-commerce businesses can make informed decisions about restocking, product categorization, and warehouse optimization to improve efficiency and profitability.
Key Terms to Know
- Warehouse Capacity: Displays the total storage capacity of the warehouse.
- Warehouse Utilization %: Shows the percentage of warehouse capacity currently being utilized.
- Non-moving Products Overview: Provides an overview of products with little to no sales activity.
- Fast Moving Products with Zero Stock: Lists high-demand products that are currently out of stock.
- Product & Stock Movement Summary: Summarizes the movement of products in and out of the warehouse.
- Product Excess & Short Report: Highlights products with excess stock and those with stock shortages.
Dashboard Template Insights
Here are four key achievements of this dashboard wireframe:
- Provides a detailed snapshot of revenue and sales performance, making it easy to gauge business health.
- Delivers valuable information on customer demographics and behavior, aiding in targeted marketing efforts.
- Highlights conversion rates, helping to identify successful strategies and areas needing improvement.
- Enables quick recognition of sales and customer trends, supporting proactive business decisions.
Conclusion
In conclusion, this wireframe provides a comprehensive overview of critical business metrics. By highlighting key areas such as sales, orders, warehouse capacity, and product movement, it equips businesses with valuable insights. This platform enables effective management of inventory, customer satisfaction, and overall performance, ensuring a robust strategy for growth and success in the online marketplace.