What is a Dermatology Hospital Hair & Scalp Treatment Dashboard?
A Dermatology Hospital Hair & Scalp Treatment Dashboard is a specialized performance monitoring and analytics tool designed for dermatology and trichology centers. It functions much like a comprehensive Dermatology Hospital Dashboard, offering an end-to-end view of patient consultations, result evaluation, procedure types, and follow-up adherence — all in one interactive dashboard.
This hair treatment dashboard template helps dermatologists and clinic managers track PRP sessions, hair transplant procedures, mesotherapy treatments, and scalp detox therapies with real-time data. By visualizing KPIs such as Patient Progress (%), Follow-up Rate (%), Total Revenue (USD), and Average Sessions per Patient, clinics can evaluate efficiency, patient satisfaction, and profitability across hair and scalp care services. It also supports Scalp Treatment Analytics for deeper insight into treatment trends and outcomes.
How To Create a Dermatology Hospital Hair & Scalp Treatment Dashboard
You don’t need to build your report from scratch—just start with a ready-to-use sample Dermatology hospital hair and scalp treatment dashboard template at Mokkup. Add in your data and export it however you like. Here’s how to do it:
1. Create or Log in to Your Mokkup Account
Start by signing up on Mokkup.ai using your email. If you already have an account, just log in, and you’ll be good to go.
2. Choose and Customize Your Dashboard Template
You can find the Dermatology Hospital Hair & Scalp Treatment Dashboard template in the Templates section. Use the drag-and-drop editor to adjust KPIs, edit filters, or add elements based on your data.
3. Export to Your BI Tool
Once your dashboard wireframe is ready, use the BI Tool Export feature to send it directly to Power BI or Tableau for further analysis and enhancements. You can also download the dashboard as a PDF, PNG, or JPEG, embed it on a platform, or invite your team to collaborate.
Note: This is a Pro template. You’ll need a Pro subscription on Mokkup to use and customize this dashboard wireframe. Upgrade anytime to unlock full access.
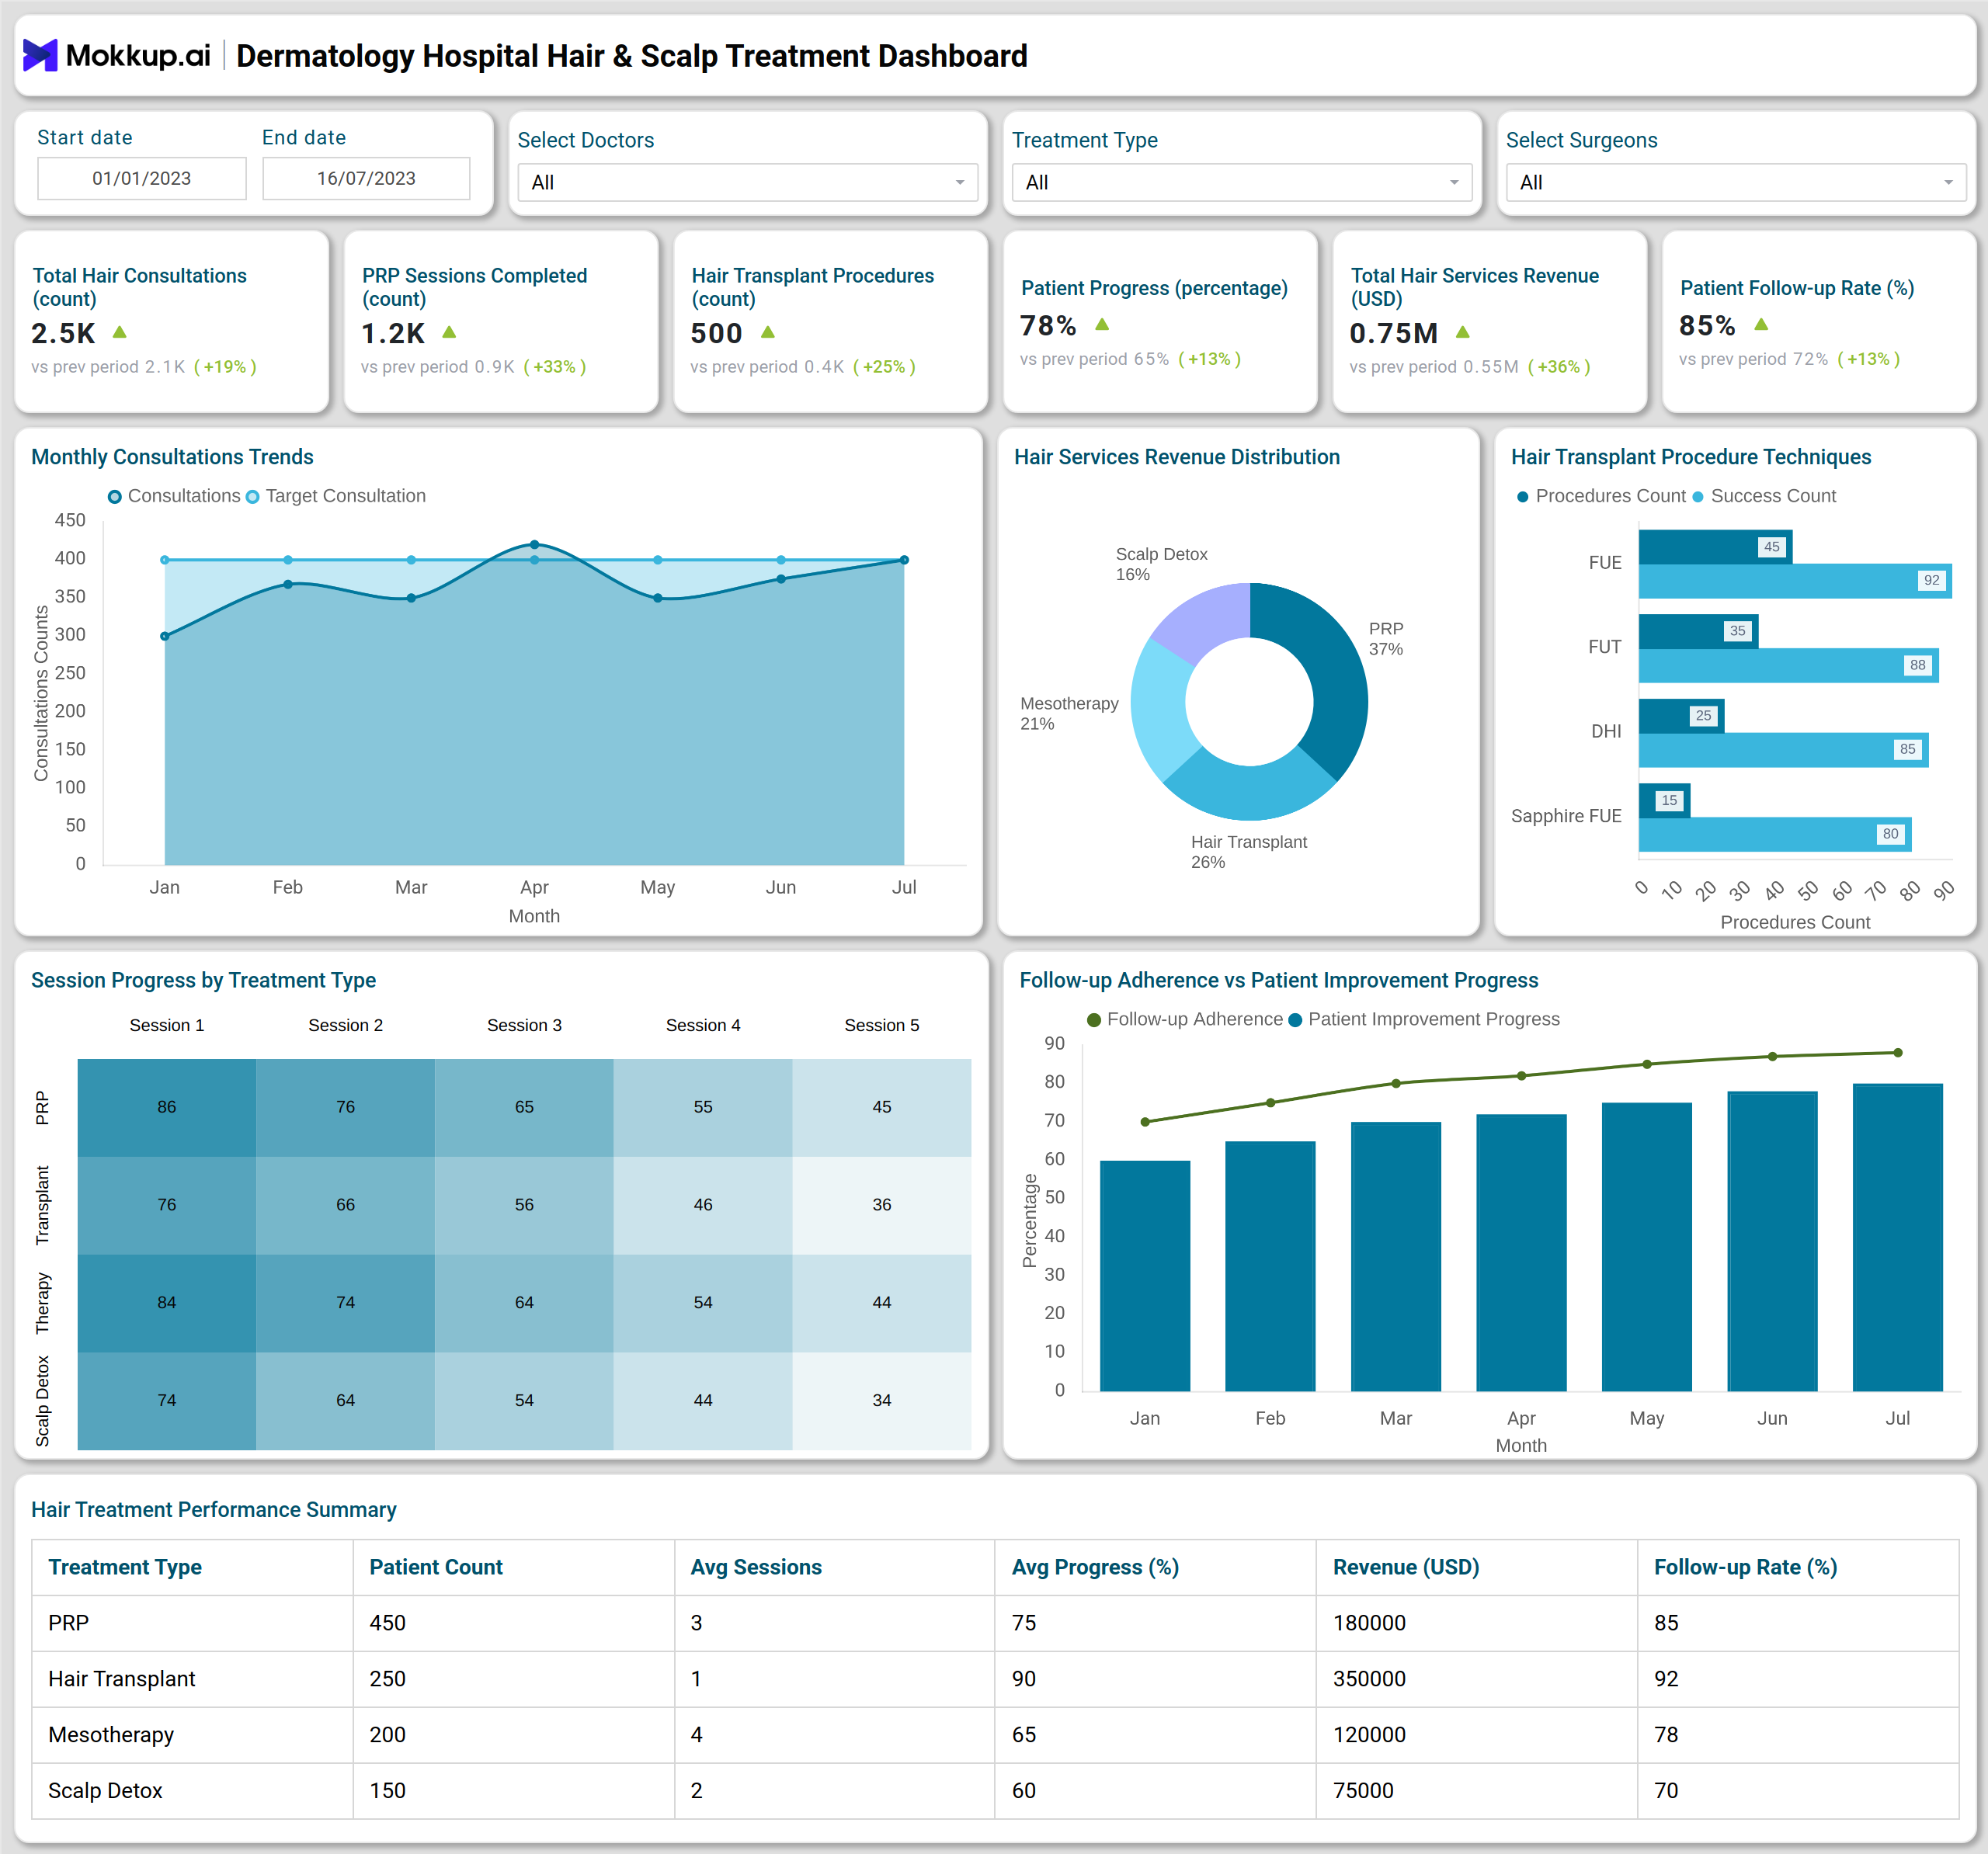
Dermatology Hospital Hair & Scalp Treatment Dashboard Example
The example Hair & Scalp Treatment Dashboard provides a complete overview of dermatology and trichology performance metrics — covering consultations, treatments, and revenue insights. At the top, the dashboard highlights key KPIs such as Total Hair Consultations (count), PRP Sessions Completed, Hair Transplant Procedures, Patient Progress (%), Total Hair Revenue (USD), and Follow-up Rate (%). These indicators allow clinical managers to evaluate both operational throughput and patient outcomes in real time through effective Dermatology Performance Monitoring, enahncing overall patient experience.
The Monthly Consultation Trends line chart illustrates the steady growth in consultations and treatment sessions over time, while the Hair Services Revenue Distribution pie chart breaks down income from PRP, Hair Transplant, Mesotherapy, and Scalp Detox services — enabling clinics to see which treatment categories drive the most profit. The Hair Transplant Procedure Techniques bar chart compares the performance of popular methods such as FUE, FUT, DHI, and Sapphire FUE, showing both procedure count and success rates. This also serves as a useful Hair Transplant Performance Dashboard component.
How to Analyze Data in Hair & Scalp Treatment Dashboards
To gain the most value from such scalp and hair treatment dashboard templates, focus on these key aspects:
- Patient Progress Tracking: Measure progress across treatment cycles (PRP, transplant, mesotherapy).
- Follow-up Adherence: Identify drop-offs in follow-up sessions to improve patient retention.
- Treatment Type Comparison: Analyze which services deliver the best outcomes and profitability.
- Revenue Optimization: Track monthly trends to align pricing and promotions with high-demand treatments.
- Technique Performance: Compare success rates of transplant methods (FUE, FUT, DHI, Sapphire FUE).
Benefits of Using a Hair & Scalp Treatment Dashboard
Implementing a dermatology hospital hair treatment dashboard offers both clinical and operational advantages:
- Improved Patient Progress Tracking: Real-time insights into recovery and response to treatment.
- Optimized Treatment Scheduling: Identify best-performing treatments and reduce idle sessions.
- Revenue Growth: Monitor income by service and maximize profitability across offerings.
- Enhanced Patient Retention: Analyze follow-up and satisfaction rates for improved engagement.
- Data-Driven Decision Making: Evaluate clinical techniques and staff performance objectively.
KPIs to Track in Hair & Scalp Treatment Dashboards
You can track the following KPIs directly with a Hair and scalp treatment dashboard:
- Total Hair Consultations (count) – Total number of hair and scalp consultations conducted.
- PRP Sessions Completed (count) – Tracks patient volume and treatment frequency.
- Hair Transplant Procedures (count) – Monitors procedure load and growth rate.
- Patient Progress (%) – Measures improvement in hair density or scalp condition.
- Follow-up Rate (%) – Indicates patient adherence and satisfaction.
- Total Hair Services Revenue (USD) – Evaluates business performance by treatment type.
Frequently Asked Questions
1. What is the purpose of a Hair & Scalp Treatment Dashboard?
It helps dermatology clinics analyze treatment success, monitor follow-ups, and optimize operational and financial performance.
2. Can I track multiple treatment types in one dashboard?
Yes, the hair treatment dashboard template helps you manage PRP, transplants, mesotherapy, and detox treatments simultaneously.
3. Who can benefit from this dashboard?
Dermatology hospitals, trichology centers, and cosmetic clinics can all use this dashboard to monitor performance and patient progress.