What is a Dermatological Results Evaluation Dashboard?
The Dermatological Results Evaluation dashboard template provides an in-depth view of dermatological treatment performance and patient outcomes. Split into two screens, it offers insights into treatment success rates, patient satisfaction, recurrence trends, and operational metrics like revenue and no-show rates. This Skin health KPI dashboard helps dermatology clinics make informed decisions to enhance patient care, optimize resources, and improve clinic efficiency.
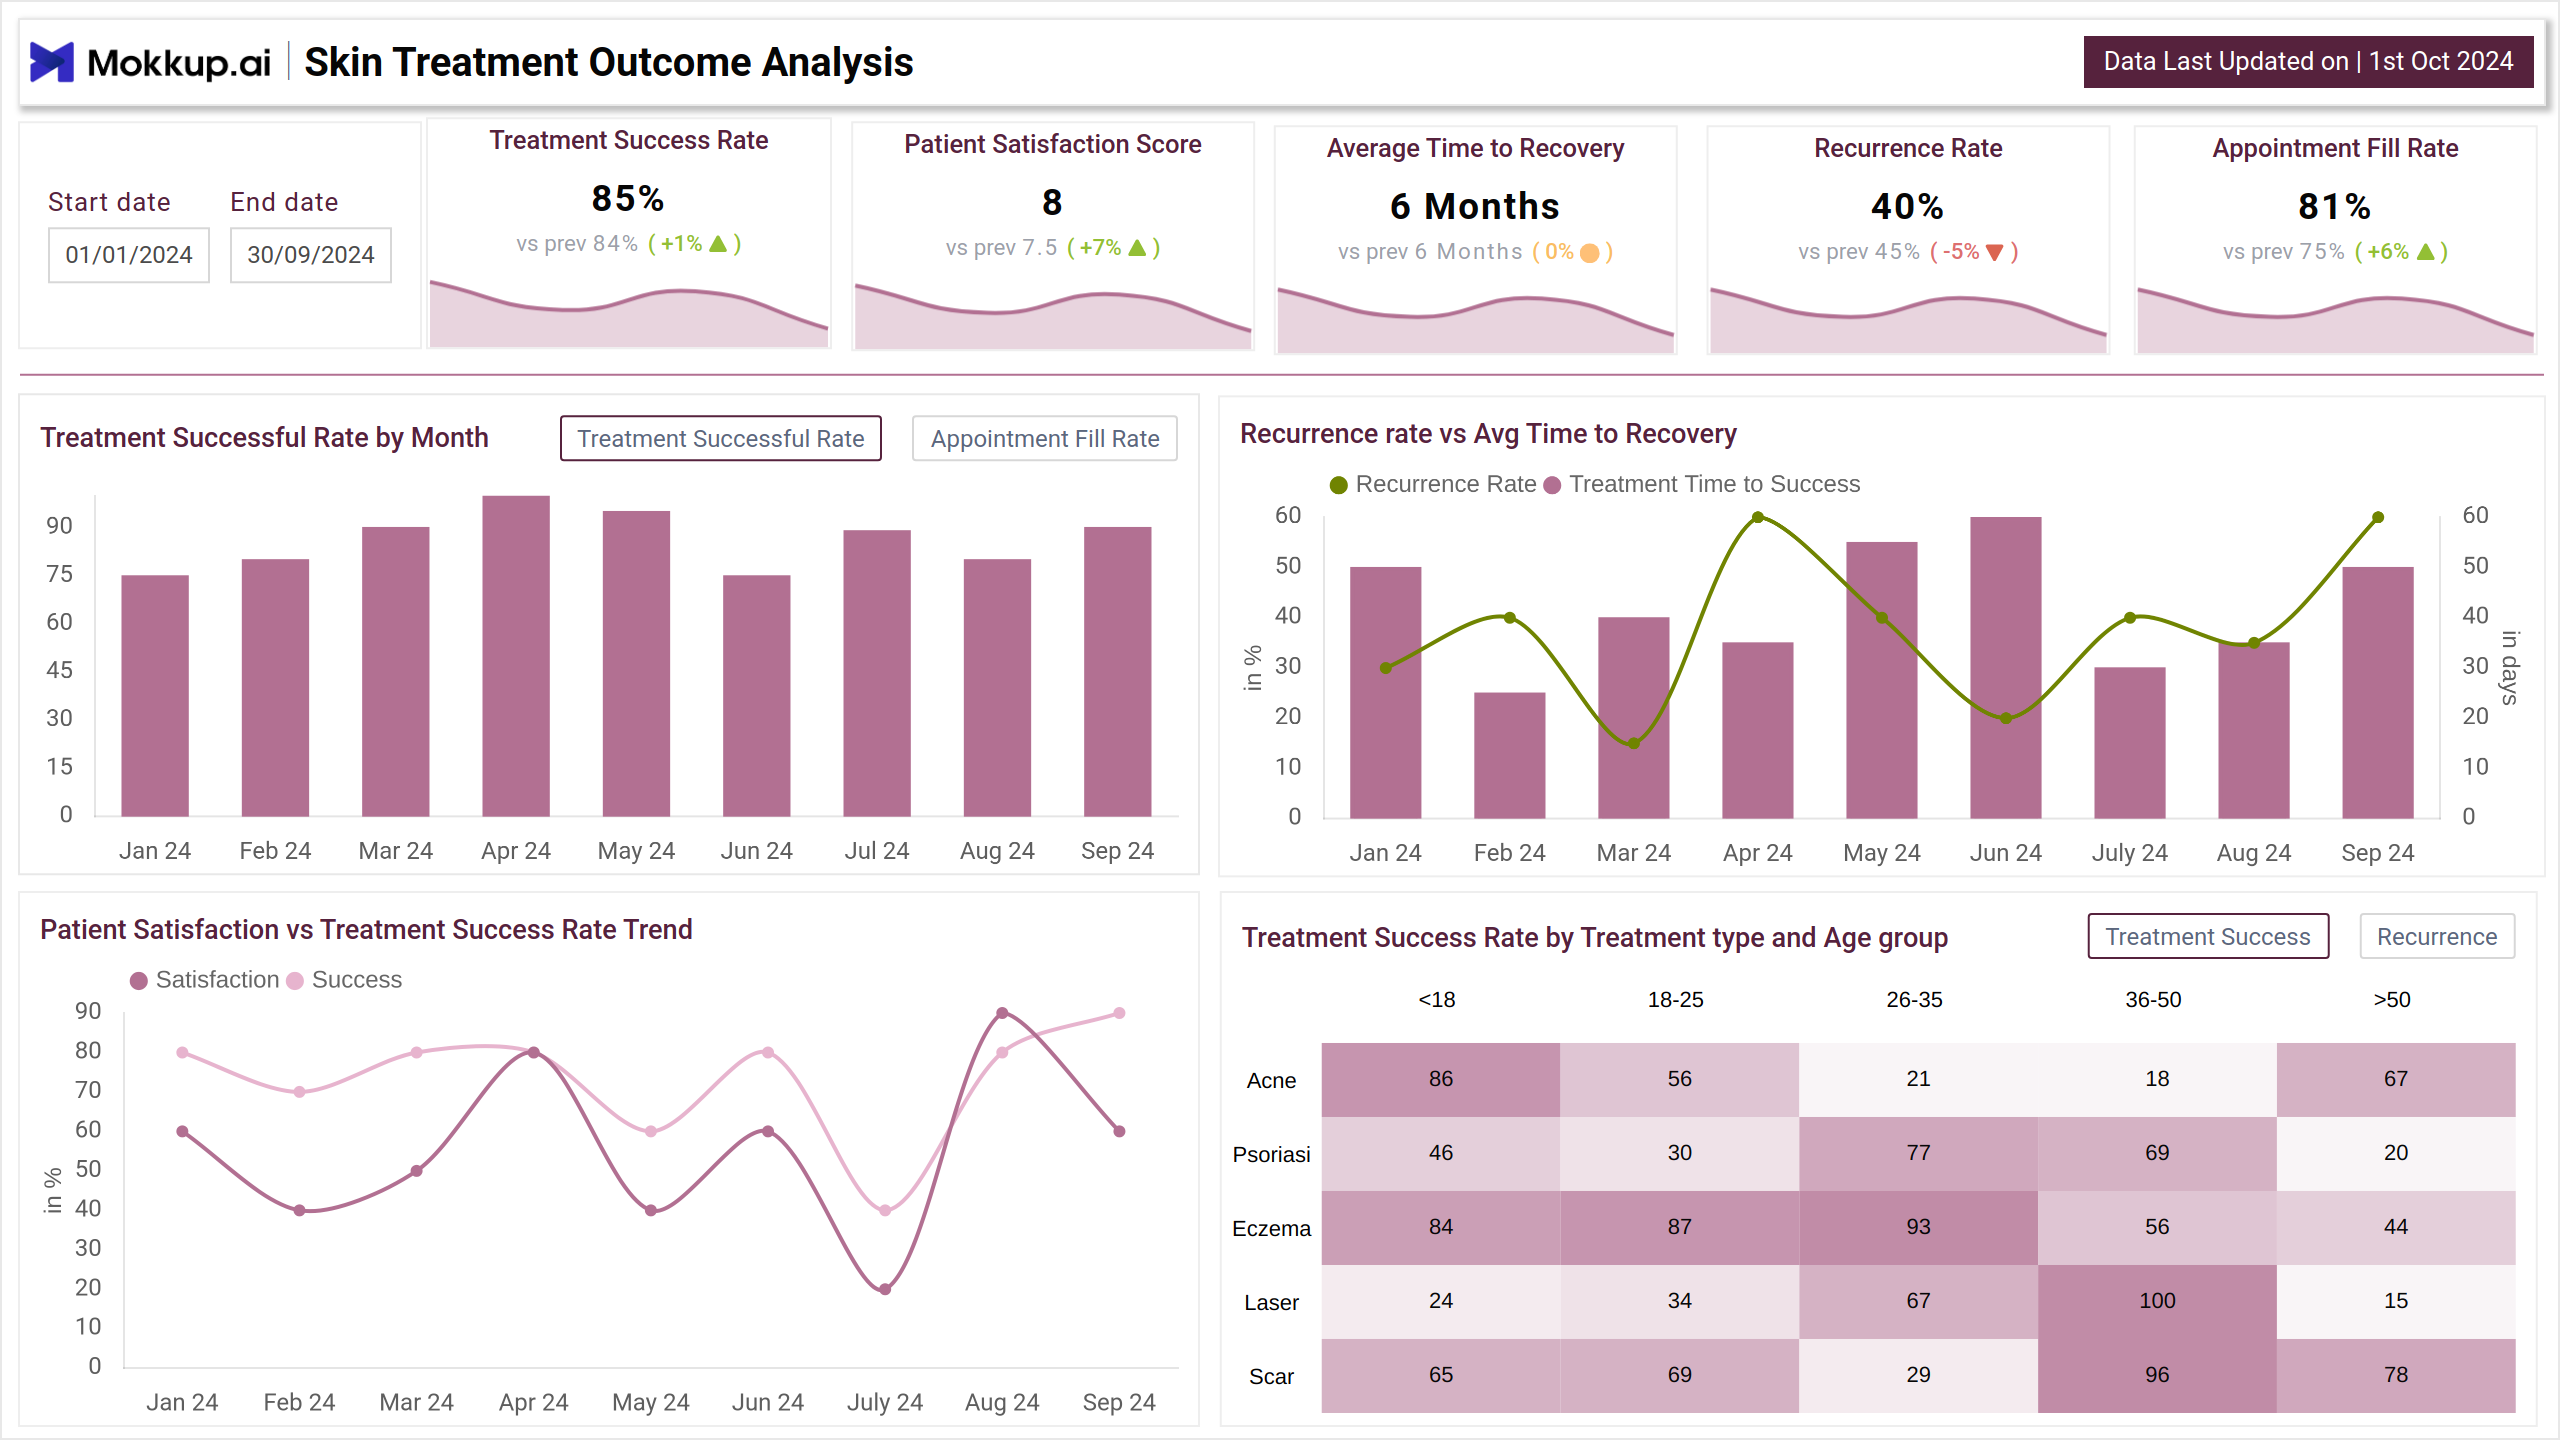
Dermatology Dashboard Example
Mokkup.ai dermatology dashboard is an example of the best dermatology data visualization dashboard that helps you measure clinical effectiveness and performance. This dashboard wireframe uses a line chart for treatment success rate and a heatmap for age and treatment type distribution. By applying the preferred data filter, you can get the medical data for effective decision-making.
How to Analyze Data in Dermatological Dashboards
The patient skin report dashboard contains data points such as treatment success rates, average time to recovery, appointment fill rates, and more. Recovery duration is displayed using bar or box plots by treatment type. Analyzing revenue trends can help you identify high-performing services or seasonal dips. No-show dates provide an overview of peak performance days so that you can adjust staff availability and clinic hours. This can be similar to a booking performance monitor that optimizes appointment scheduling metrics.
How to Create a Dermatology Results Dashboard
This Skin treatment outcomes tracker can be created in just three simple steps, which are:
1. Create or Log in to Your Mokkup Account
Start by signing up on Mokkup.ai using your email. Already have an account? Just log in, and you’re good to go.
2. Choose and Customize Your Dashboard Template
Find the Dermatology Results Dashboard in the Templates section. Use the drag-and-drop editor to adjust KPIs, edit filters, or add elements based on your data.
3. Export to Your BI Tool
Once your dashboard wireframe is ready, use the BI Tool Export feature to send it directly to Power BI or Tableau for further analysis and enhancements. You can also download the dashboard as a PDF, PNG, or JPEG, embed it on a platform, or invite your team to collaborate.
Note: This is a Pro template. You’ll need a Pro subscription on Mokkup to use and customize this dashboard wireframe. Upgrade anytime to unlock full access.
Benefits of Dermatological Dashboards
This dashboard allows medical dermatology analytics to monitor clinical activities, keep track of pending tasks, and provide real-time reporting care, thereby improving the quality of practice. Here is a breakdown of benefits:
- Help monitor and evaluate treatment effectiveness and outcomes
- Improve appointment scheduling and reduce no-show rates
- Enable data-driven clinical decisions for better patient care
- Helps refine treatment protocols by correlating recovery time with recurrence rates and patient feedback.
KPIs to Track in Dermatology Dashboards
This dashboard can measure the following key KPIs:
- Treatment Success Rate: Measures the percentage of successful treatments across all types.
- Patient Satisfaction Score: This gauges patient contentment with treatments and provides insights into the correlation between clinic reputation and patient retention.
- Recurrence Rate: Tracks the percentage of patients requiring follow-up treatment for the same condition.
- Appointment Fill Rate: Measures how efficiently appointments are utilized and highlights operational efficiency in scheduling and patient attendance.
- Recurrence Rate vs. Average Time to Recovery: This evaluates the relationship between recurrence trends and recovery time.
Frequently Asked Questions
1. How can a treatment progress monitoring dashboard improve patient care?
By tapping into patient demographics and treatment effectiveness, dermatologists can improve recovery outcomes by personalising care plans.
2. Who can access this dashboard?
This dashboard allows dermatologists, clinic managers, and healthcare administrators role-based access. Users' usage and activity depend on their needs and permissions.