What is a Dental Specialty Dashboard?
A Dental specialty dashboard is a digital tool designed to centralize and visualize metrics related to specialty dental services provided within clinics, hospitals, or dental institutions. Leveraging dental service utilization analytics, this dashboard tracks performance metrics across different specialty areas such as orthodontics, pediatric dentistry, maxillofacial surgery, and periodontics. The dashboard enables dental administrators and providers to understand workflows, measure patient outcomes, and assess operational efficiency. By consolidating dental specialty service usage data, institutions can quickly spot trends, respond to shifts in caseloads, and optimize resource allocation for exceptional patient care.
How to Create a Dental Specialty Dashboard
You don’t need to build your report from scratch—start with a ready-to-use dashboard template from Mokkup. Add in your data and export it however you like. Here’s how to do it:
1. Create or Log in to Your Mokkup Account
Start by signing up on Mokkup.ai using your email. If you already have an account, log in, and you’ll be good to go.
2. Choose and Customize Your Dashboard Template
Find the Dental specialty dashboard template in the Templates section. Use the drag-and-drop editor to adjust KPIs, edit filters, or add elements based on your data.
3. Export to Your BI Tool
Once your dashboard wireframe is ready, use the BI Tool Export feature to send it directly to Power BI or Tableau for further analysis and enhancements. You can also download the dashboard as a PDF, PNG, or JPEG, embed it on a platform, or invite your team to collaborate.
Note: This is a Pro template. You’ll need a Pro subscription on Mokkup to use and customize this dashboard wireframe. Upgrade anytime to unlock full access.
Dental Specialty Dashboard Example
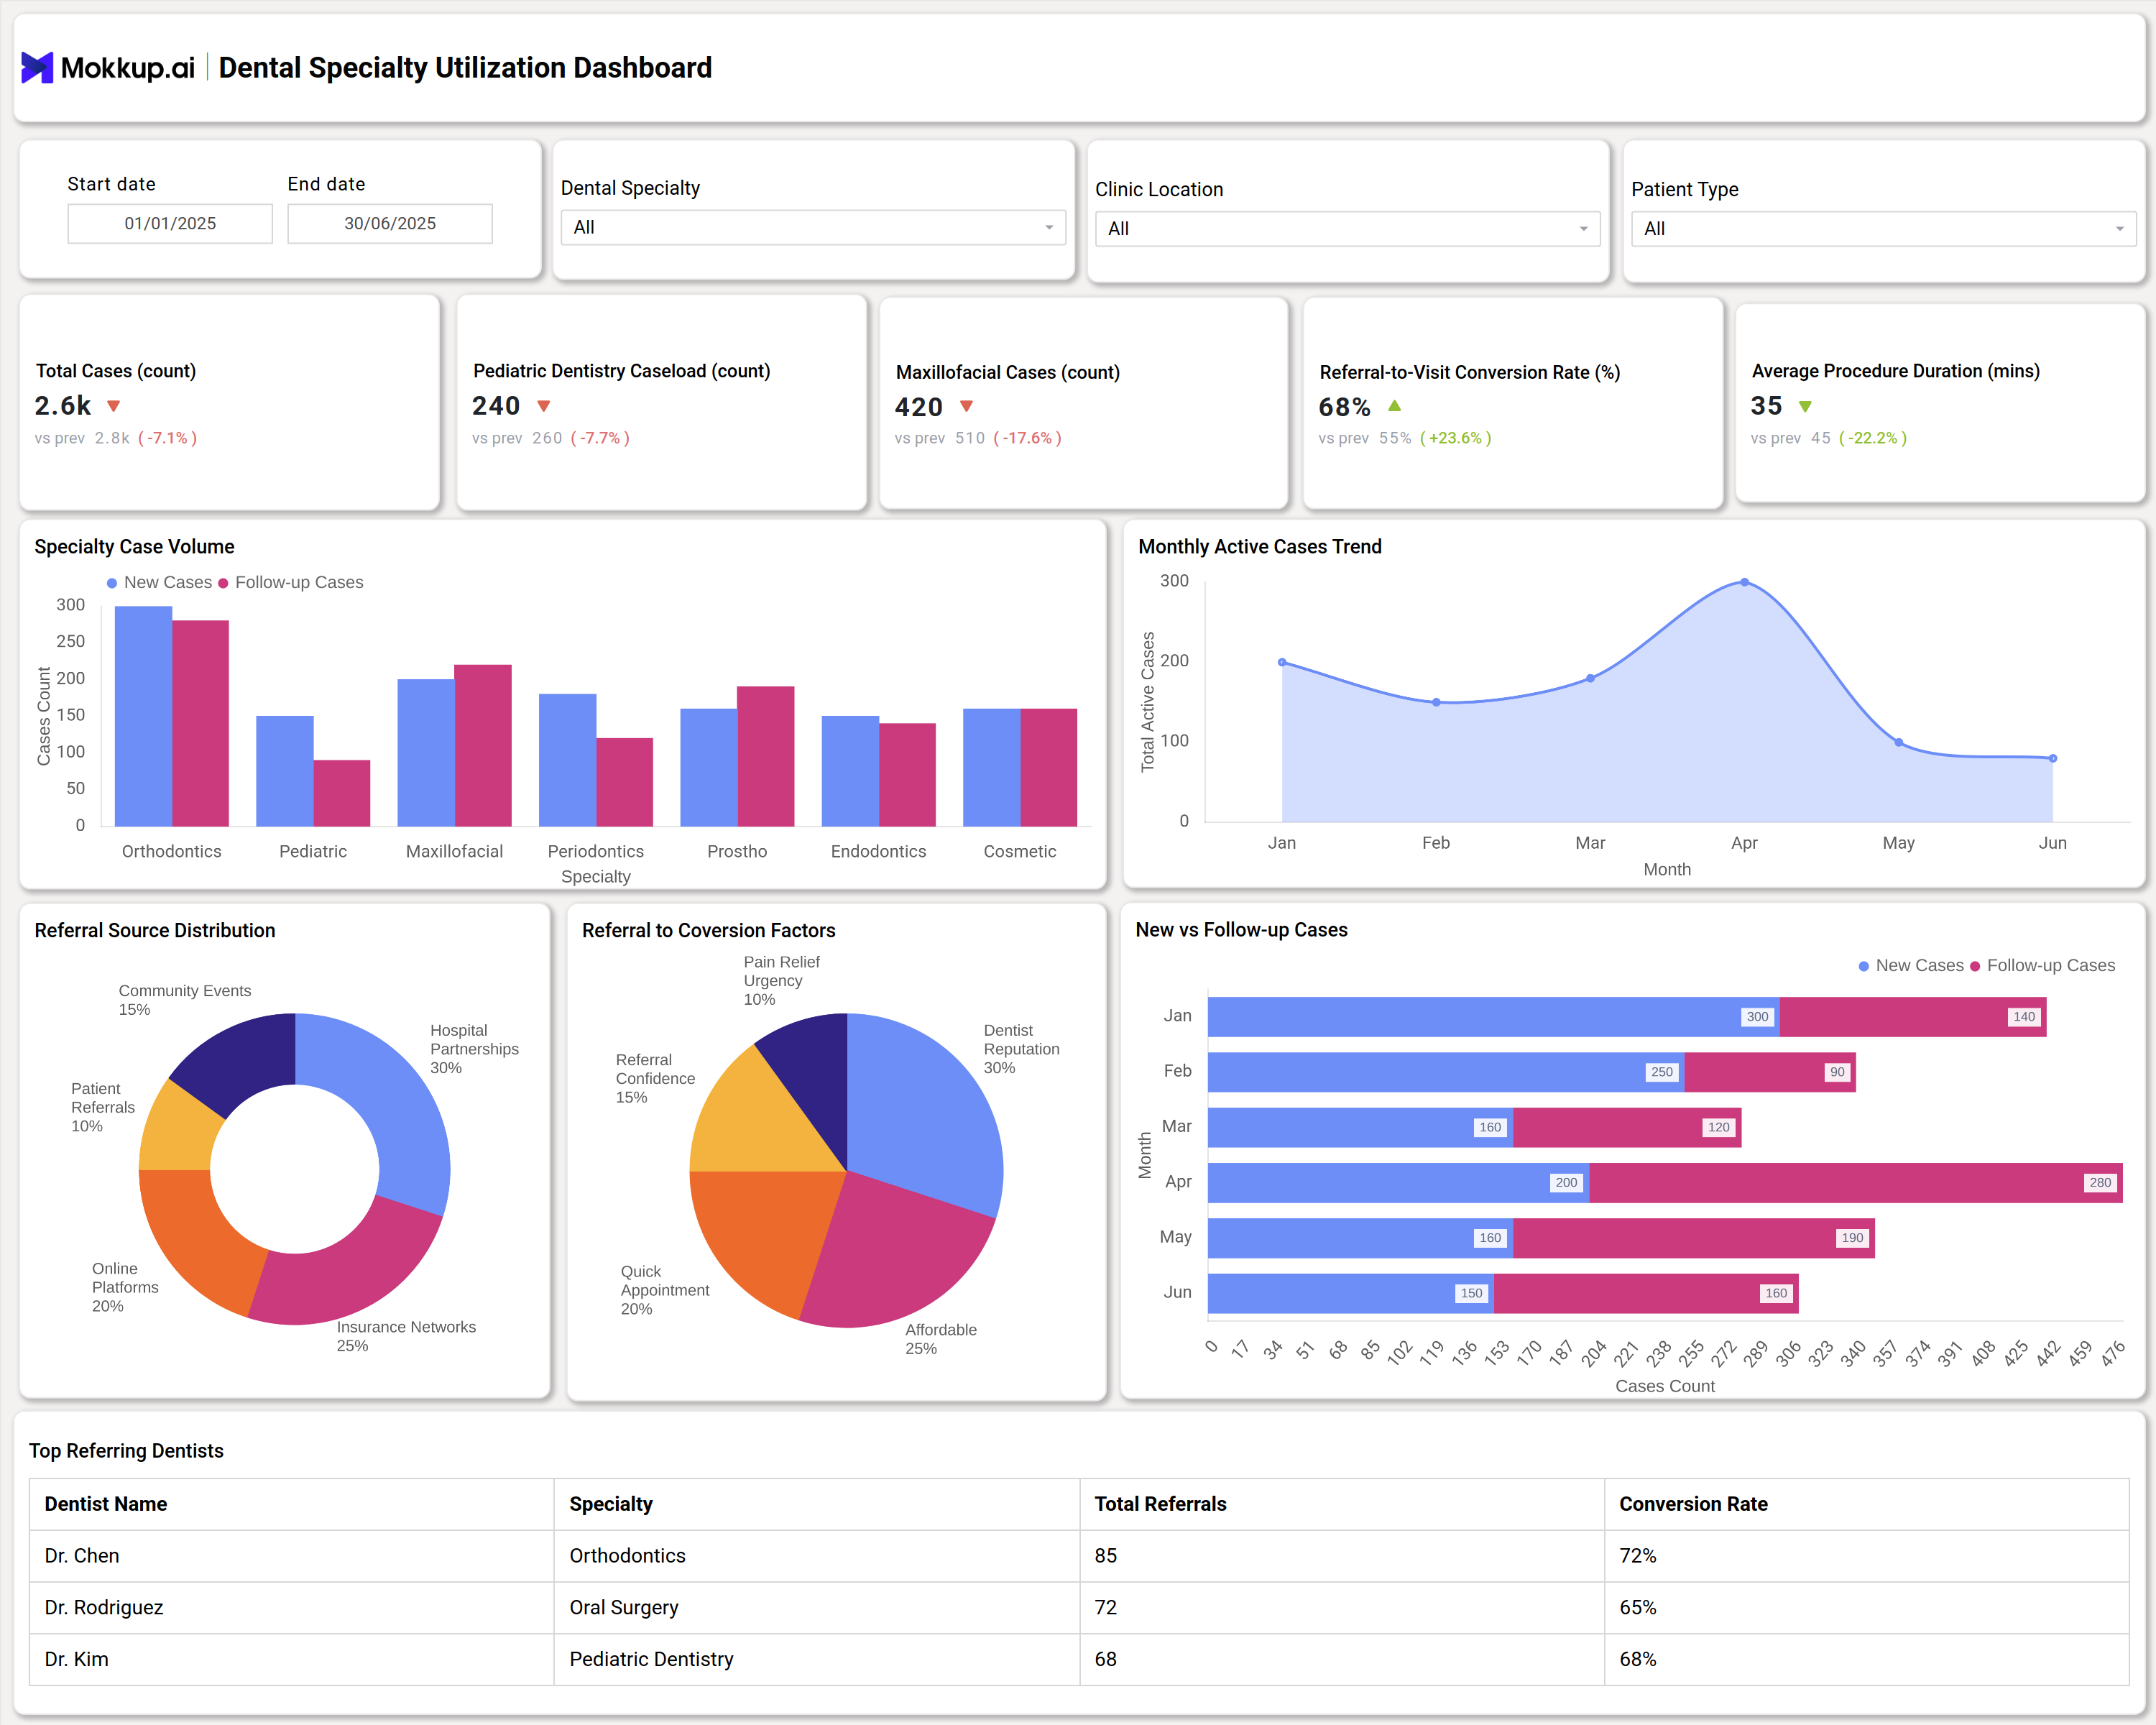
A dental specialty dashboard typically displays real-time metrics for total cases, individual specialty caseloads (including pediatric dentistry, maxillofacial cases, and more), referral-to-visit conversion rates, and average procedure duration. Visualizations include monthly active case trends, referral source distributions, and conversion factors, providing clear insights into operational performance. As a leading dental specialty dashboard reporting tool, it tracks specialty case volumes and highlights data for both new and follow-up cases. Additionally, the dashboard showcases breakdowns by referral channels—patient referrals, insurance networks, hospital partnerships—and ranks top referring dentists to help identify growth opportunities and streamline practice management.
How to Analyze Data in Dental Specialty Dashboards
Here is how you can analyze data in the Dental Specialty Dashboard:
- Review dental services utilization trends to understand fluctuations in case volumes across specialties.
- Examine referral source distributions to pinpoint effective channels for patient acquisition.
- Evaluate conversion factors and referral confidence for practical improvement steps.
- Monitor KPIs like total cases, average procedure duration, and conversion rates to benchmark performance.
- Drill down into specialty-specific metrics and usage data to optimize scheduling and resource allocation.
- Compare new vs. follow-up case ratios to anticipate patient revisit patterns and specialty demand.
Benefits of Dental Specialty Dashboards
These are the benefits of using the Dental Specialty Dashboard:
- Improve practice efficiency with real-time dental specialty dashboard reporting.
- Enhance patient care by tracking dental specialty services metrics and optimizing treatment delivery.
- Identify underperforming channels with dental utilization tracking tools and refine referral strategies.
- Drive informed decisions using dental specialty performance dashboard data and analytics.
- Monitor emerging trends in specialty service utilization for proactive resource planning.
KPIs to Track in Dental Specialty Dashboards
The following are KPIs included in the Dental Specialty Dashboard:
- Total Cases: Number of specialty dental cases handled in the selected period.
- Specialty Caseload Count: Volume of cases segmented by dental specialties.
- Referral-to-Visit Conversion Rate: Percentage showing how many referrals convert to actual visits.
- Average Procedure Duration: Average time taken to complete specialty dental procedures.
- Referral Source Distribution: Breakdown of where patient referrals originate.
- Monthly Active Cases Trend: Line graph tracking ongoing specialty activity each month.
- Top Referring Dentists: Ranking of practitioners driving the highest patient volume.
Frequently Asked Questions
1. What specialties can be tracked in a dental specialty dashboard?
Most dashboards track orthodontics, pediatric dentistry, maxillofacial surgery, periodontics, prosthodontics, endodontics, and cosmetic dentistry.
2. What is the value of tracking dental specialty service usage data?
Usage data highlights specialty demand, empowers efficient scheduling, and supports data-driven clinical decisions.
3. Can the dashboard be customized for my institution’s needs?
Yes, most dental specialty performance dashboards offer customizable views for unique clinical workflows.