
The Customer Finance Analytics dashboard template is a comprehensive tool that offers invaluable insights into diverse financial facets of customer-centric operations. It spans dimensions like revenue, cost, profitability, and financial performance and is designed to empower businesses with informed decisions aimed at enhancing customer profitability.
Customer Finance Analytics -1
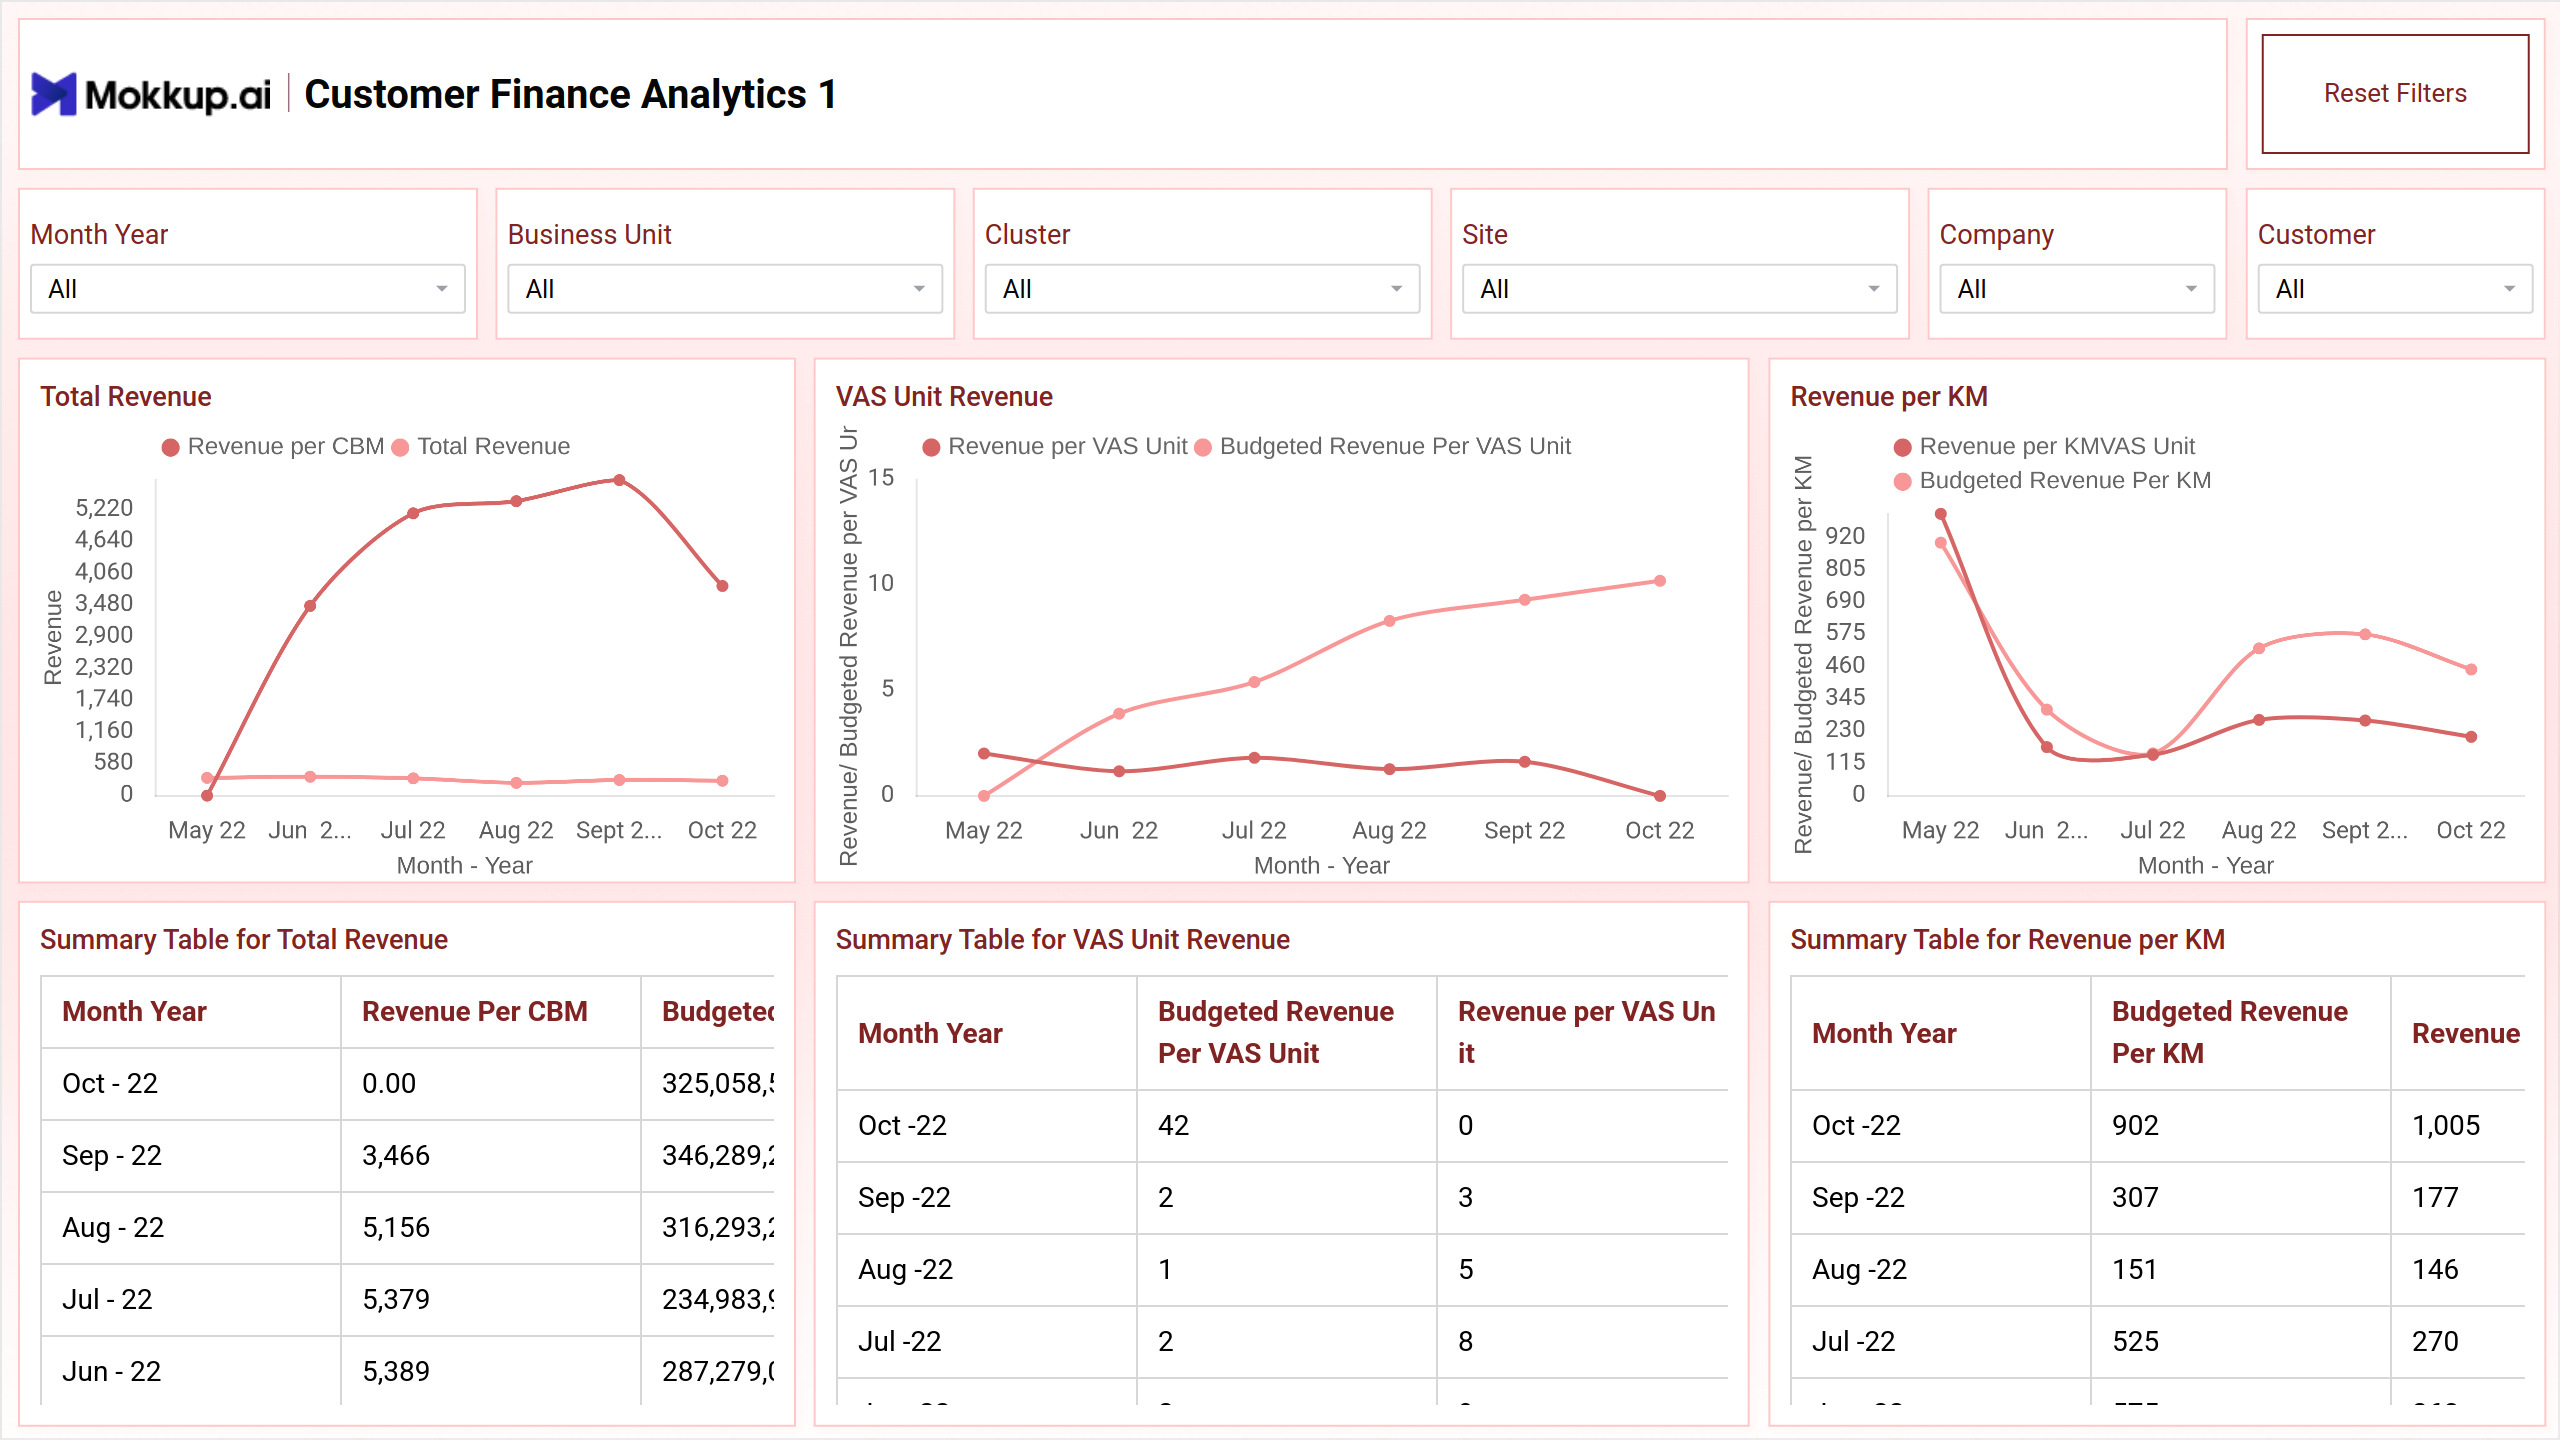
Customer Finance Analytics - Screen 1 offers insights into various revenue streams crucial for financial analysis. It includes metrics such as total revenue, VAS unit revenue, and revenue per kilometer (KM), along with corresponding budgeted values.
Key Terms to Know
Total Revenue Insights:
- Analysis of total revenue metrics, including revenue per Cubic Meter (CBM) and overall total revenue.
- Provides a comprehensive overview of revenue generation from logistics operations.
VAS Unit Revenue Examination:
- Evaluation of revenue generated from Value-Added Services (VAS) per unit, along with budgeted values.
- Helps in assessing the performance and profitability of VAS offerings.
Revenue per Kilometer (KM) Analysis:
- Assessment of revenue generated per kilometer traveled, including revenue per KM from VAS units and budgeted revenue per KM.
- Helps in understanding the revenue efficiency of transportation services.
Summary Tables for Key Revenue Metrics:
- Consolidated summary tables for total revenue, VAS unit revenue, and revenue per KM.
- Provides a quick reference for comparing actual performance against budgeted values and identifying areas for improvement.
Overall, Screen 1 offers valuable insights into revenue generation across different dimensions, enabling informed decision-making and strategic financial management within the logistics industry.
Customer Finance Analytics - 2
Customer Finance Analytics - screen 2 focuses on analyzing critical financial metrics related to logistics operations. Specifically, it provides insights into the contribution per Cubic Meter (CBM) and tracks contribution trends over time, comparing actual performance against budgeted targets.
Key Terms to Know
- Contribution per Cubic Meter (CBM): Evaluates the revenue contribution generated per unit of volume, offering insights into the profitability of logistics operations in relation to volume metrics.
- Contribution Trend: Tracks the trend of contribution over time, comparing actual performance against budgeted targets to evaluate financial performance and identify areas for improvement.
Additionally, the screen features summary tables presenting detailed information on contribution per CBM and contribution trends, helping users in making data-driven decisions to optimize financial performance and enhance profitability.
Customer Finance Analytics - 3
In the Customer Finance Analytics - screen, users gain valuable insights into the contribution metrics associated with Value-Added Service (VAS) units and kilometers traveled. It offers comparative analysis against budgeted figures for enhanced performance evaluation.
Key Terms to Know
- Contribution per Value-Added Service (VAS) Unit: Analyzes the contribution generated per VAS unit compared to the budgeted contribution per unit.
- Contribution per Kilometer (KM): Evaluating the contribution generated per kilometer traveled compared to the budgeted contribution per kilometer.
- The summary tables reflect the contribution per VAS unit and contribution per kilometer, offering an overview of financial contributions and helping in decision-making processes related to service offerings and operational efficiency.
Customer Finance Analytics - Cost
Screen 4 delves into detailed financial metrics, including storage cost per Cubic Meter (CBM), VAS unit cost, and month-wise cost and CBM differences. It offers insights into revenue generation and budget adherence for value-added services through a comprehensive table displaying month-year data, budgeted revenue per VAS unit, and revenue per VAS unit.
Key Terms to Know
- Storage Cost per Cubic Meter (CBM): Analyzing the cost incurred per CBM of storage compared to the budgeted storage cost per CBM, helping in evaluating the efficiency of storage operations.
- VAS Unit Cost: Evaluating the cost incurred per Value-Added Service (VAS) unit compared to the budgeted VAS unit cost, providing insights into the profitability of value-added services offered.
- Month-wise Cost and CBM Difference: Highlighting the differences in cost and CBM (Cubic Meter) over each month, aiding in tracking cost fluctuations and volume changes over time.
- Month-Year Table: highlights budgeted revenue per VAS unit, and revenue per VAS unit, offering an overview of revenue generation and budget adherence for value-added services.
These insights enable businesses to increase costs, monitor revenue performance, and make informed decisions to improve financial outcomes.
Customer Finance Analytics - P&L
Screen 5 of the Customer Finance Analytics dashboard wireframe offers detailed insights into the organization's Profit and Loss (P&L) statements.
Key Terms to Know
- EDITDA per Month: Evaluating Earnings Before Interest, Taxes, Depreciation, and Amortization (EDITDA) per month, including overhead costs and their budgeted counterparts, along with overhead as a percentage of total revenue.
- Interest (Company) per Month: Analyzing interest expenses incurred by the company per month compared to the budgeted amounts.
- Depreciation per Month: Assessing depreciation expenses per month in comparison to budgeted figures.
- Net Profit per Month: Examining the net profit generated by the company per month, including budgeted net profit.
- Interest Cover per Month: Calculating the interest cover ratio per month, indicating the company's ability to cover interest expenses with its earnings.
- Debtor Days: Tracking the average number of days it takes for the company to collect payments from debtors, helping in assessing liquidity and cash flow management.
This screen provides stakeholders with detailed financial insights to evaluate profitability, monitor financial health, and make informed decisions for financial management and strategic planning.
Customer Finance Analytics - P&L 2
Screen 6 of the Customer Finance Analytics dashboard wireframe, labeled P&L 2, offers detailed insights into financial performance metrics, providing stakeholders with essential information to evaluate profitability and financial health.
Key Terms to Know
- Profit Before Tax (PBT) per month: Includes both actual and budgeted values, alongside PBT by revenue percentage, allowing for comparisons and trend analysis.
- Profit Before Interest and Taxes (PBIT): Provides actual and budgeted values, along with PBIT by revenue percentage, offering insights into operational profitability.
- Cash Generation: Displays budgeted values for cash generation, helping in evaluating the organization's liquidity and cash flow management.
- Summary Table: Features essential financial indicators such as Earnings Before Interest, Taxes, Depreciation, and Amortization (EBITDA), PBT, PBIT, PBT by Revenue%, and PBIT by Revenue%, facilitating a comprehensive overview of financial performance.
Additionally, these insights enable stakeholders to make informed decisions regarding financial planning, performance analysis, and strategic initiatives for the organization's growth and sustainability.
Dashboard Template Insights
The dashboard wireframe provides comprehensive insights into various financial aspects of customer-centric operations, including revenue, costs, profitability, and financial performance metrics.
- It enables organizations to optimize cash flow, mitigate financial risks, and enhance customer relationships by analyzing customer payment behaviors, credit management, invoicing accuracy, and overall financial health.
- Through detailed analysis of key metrics such as accounts receivable, payment trends, and customer profitability, businesses can identify opportunities for revenue growth, improve financial processes, and ensure compliance with financial regulations.
Conclusion
The Customer Finance Analytics dashboard template serves as a vital tool for businesses operating in customer-centric industries, offering invaluable insights to streamline financial operations, enhance customer profitability, and drive sustainable growth.