
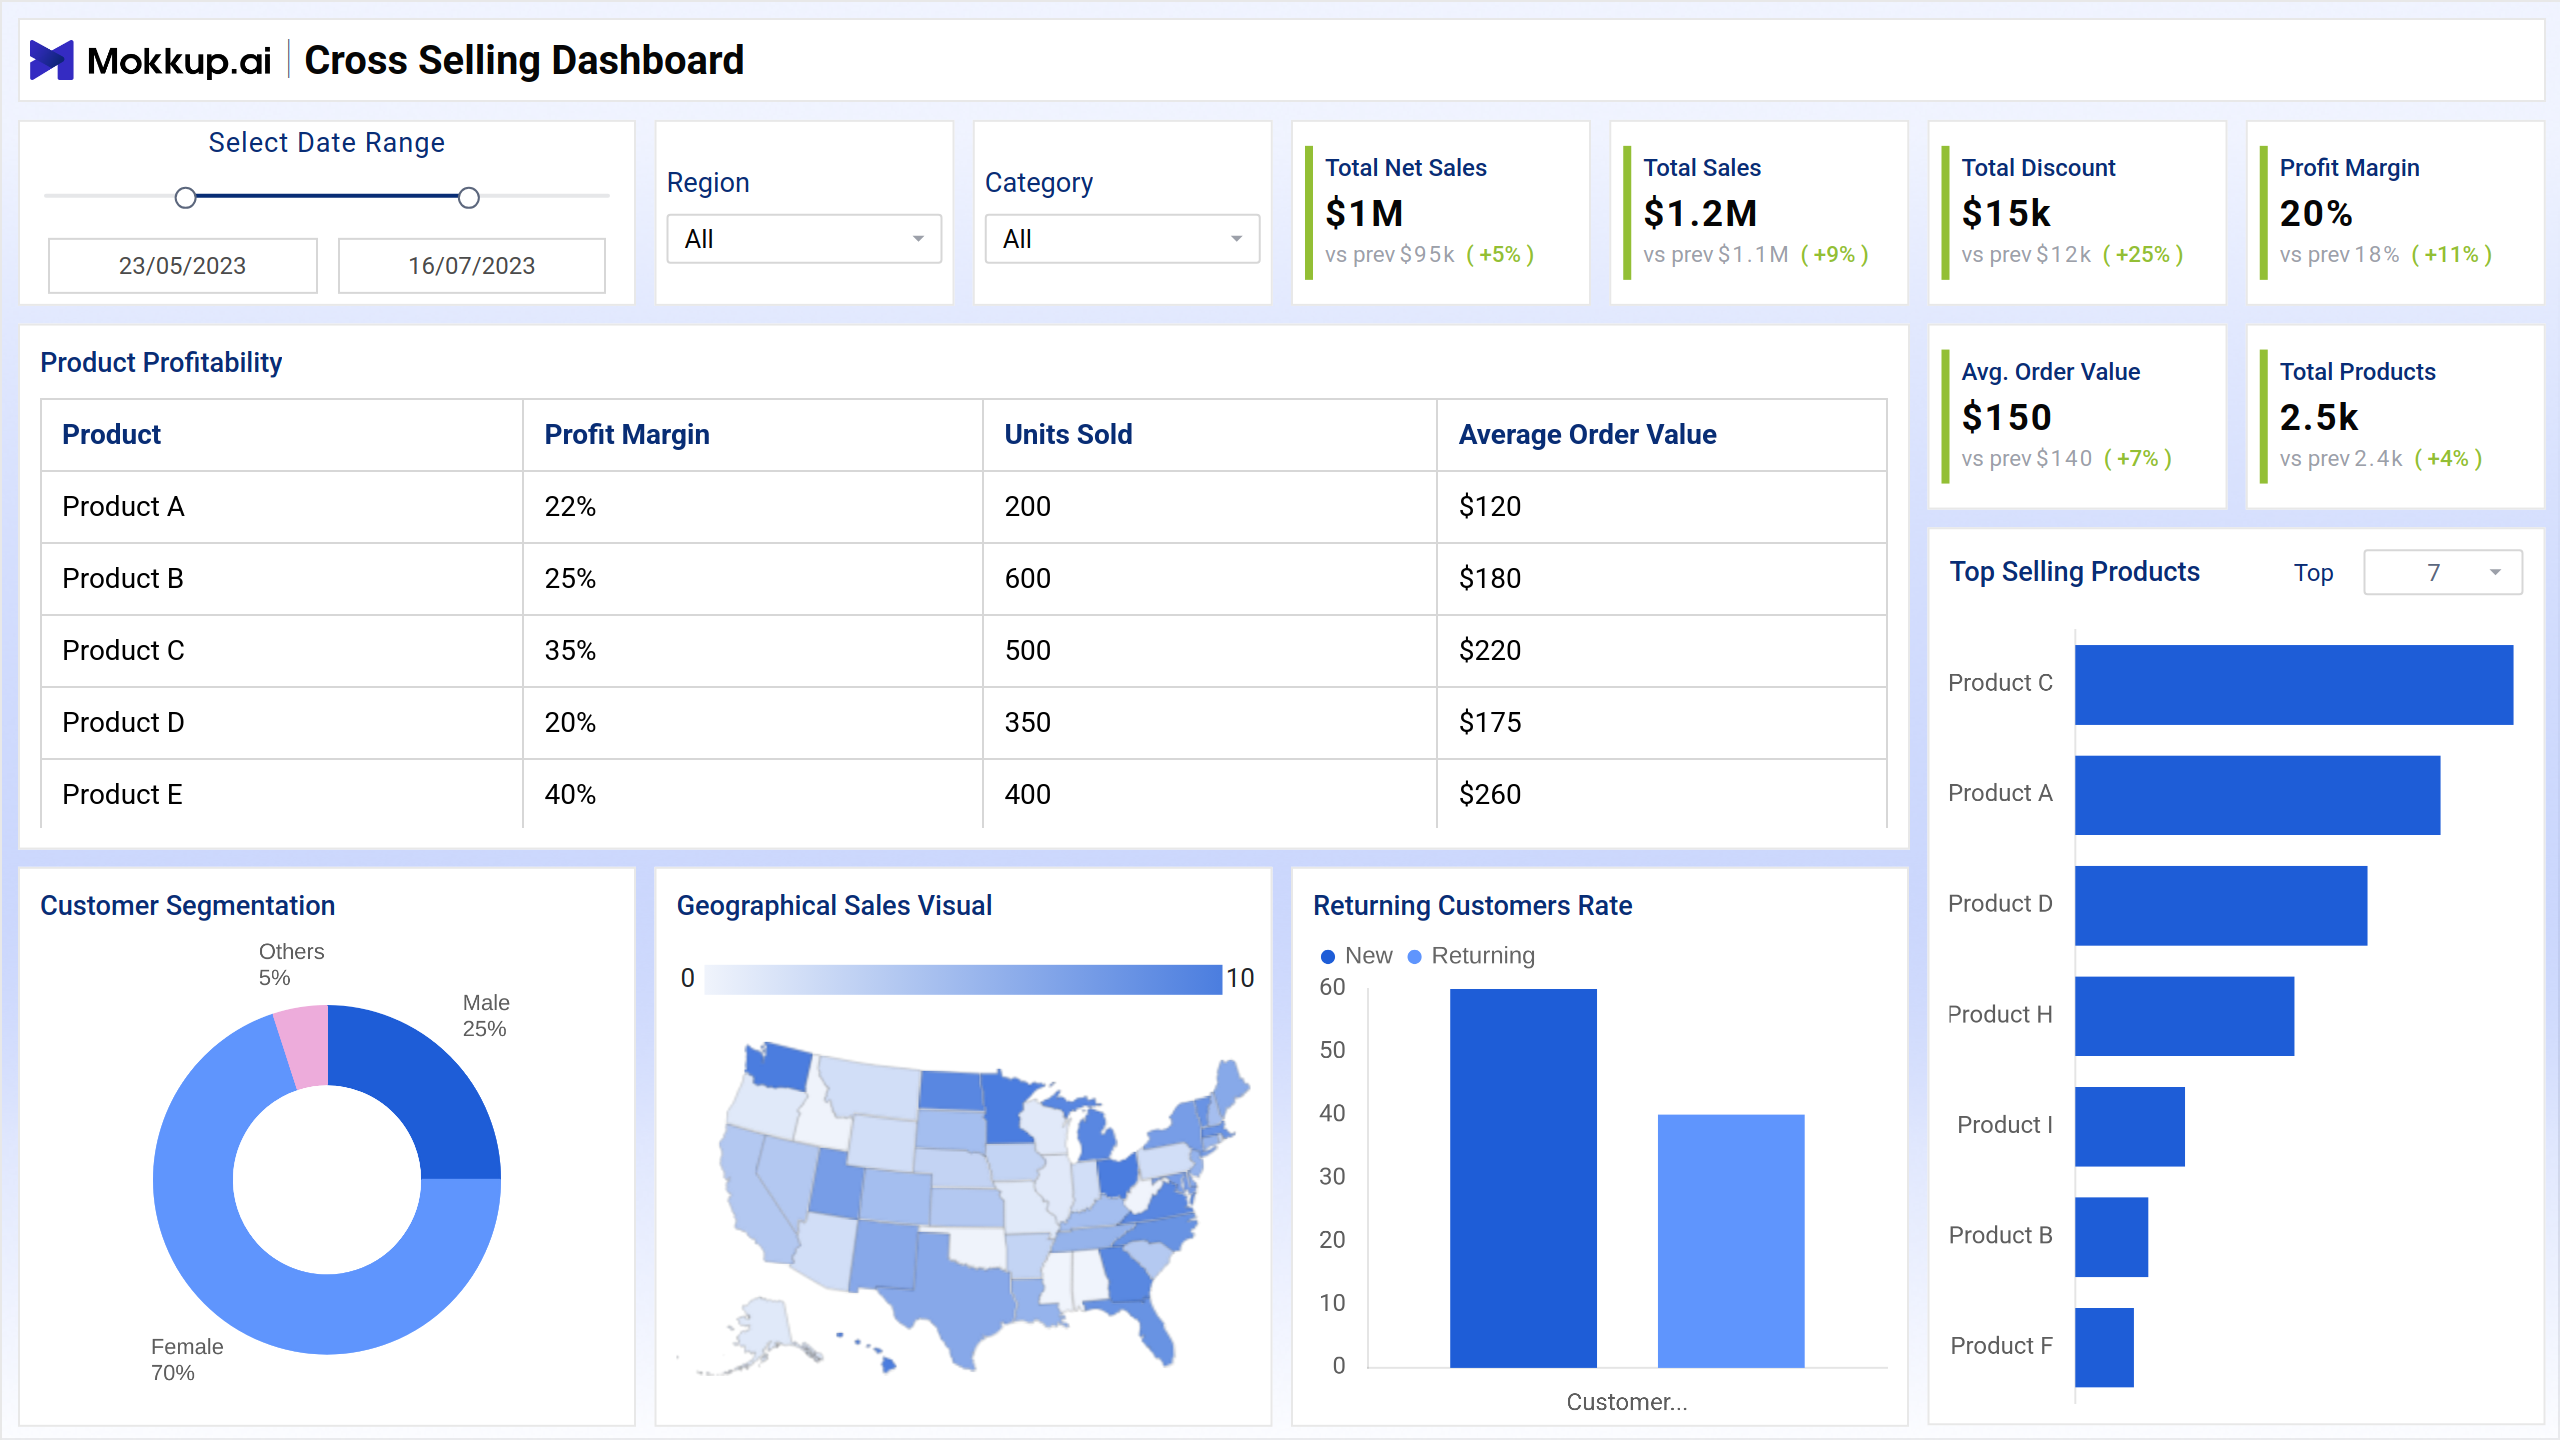
Cross-selling dashboard template designed to enhance business strategies by providing key insights into cross-selling opportunities. This dashboard presents crucial metrics such as product pairings, customer purchasing patterns, and sales performance. With clear and concise data visualization, it empowers sales teams to identify potential areas for increasing revenue and improving customer satisfaction through effective cross-selling techniques.
The dashboard wireframe comprises three screens: Overview, Cross Selling, & Up-Selling; each is explained briefly below.
Overview:
This screen provides a high-level view of your cross-selling performance. It displays key metrics such as total net sales, total sales, total discounts, and profit margin. You can see these metrics for a specific date range and compare them to the previous period. The wireframe also shows the average order value and total number of products sold. In the bottom section, you can see details on product profitability, including profit margin, units sold, and average order value for each product.
Key Terms to Know
- Total Net Sales: Indicates the overall revenue after accounting for returns and allowances.
- Total Sales: Displays the gross revenue generated from all sales.
- Total Discount: Shows the total value of discounts applied to sales.
- Profit Margin: Measures the percentage of revenue that exceeds the cost of goods sold.
- Product Profitability: Evaluates the profitability of individual products based on sales and costs.
- Avg. Order Value: Calculates the average revenue per order.
- Total Products: Indicates the total number of products available for sale.
- Customer Segmentation: Breaks down customers into distinct groups based on specific criteria such as demographics or purchase behavior.
- Geographical Sales Visual: Provides a visual representation of sales data across different geographic regions.
- Returning Customer Rate: Measures the percentage of customers who make repeat purchases.
- Top Selling Products: Identifies the products with the highest sales volumes.
Cross-Selling:
This screen allows you to analyze your cross-selling efforts. It provides a quick overview of your cross-selling performance, including total cross-selling revenue and cross-sell rate. You can view this data for a specific date range and compare it to the previous period. The wireframe also allows you to see correlations between different products and how different customer segments respond to cross-selling efforts. This information can help you identify which products are most likely to be cross-sold together and which customer segments are most receptive to cross-selling.
Key Terms to Know
- Total Cross Selling Revenue: Displays the overall revenue generated from cross-selling activities.
- Cross Sell Rate: Measures the percentage of transactions that include cross-sell items.
- Correlation Between Different Products: Analyzes the relationship and purchasing patterns between various products.
- Customer Segment Response: Evaluates how different customer segments respond to cross-selling efforts.
- Comparison of Various Products: Compares the performance of different products to identify potential cross-selling opportunities.
Up-Selling:
This screen allows you to see which products are frequently bought together, and the correlation coefficient between different products. This information can be used to identify upselling opportunities and develop more effective cross-selling strategies. The wireframe also includes filters for date range, customer segment, and region.
Key Terms to Know
- Upscale Revenue: Displays the total revenue generated from upscale products or services.
- Base Revenue: Indicates the total revenue generated from base products or services.
- Upscale Conversion Rate: Measures the percentage of customers who purchase upscale options.
- Base to Upscale Conversion Rate: Calculates the rate at which customers upgrade from base products to upscale options.
- Top Performing Upscales: Identifies the upscale products or services with the highest sales performance.
- Customer Satisfaction with Upscale: Evaluates customer satisfaction specifically for upscale products or services.
- Upscale Sales Trend: Analyzes the sales trend for upscale products over a specified period.
- Upscale Conversion Funnel: Visualizes the stages customers go through from considering to purchasing upscale options.
- Version Comparison: Compares the performance of different versions or iterations of upscale products.
Dashboard Template Insights
This dashboard wireframe provides essential insights to boost sales and customer satisfaction:
- Identifies effective product pairings and frequently bought together items, enabling strategic cross-selling initiatives.
- Analyzes purchasing patterns to understand customer preferences and tailor sales strategies accordingly.
- Highlights key areas where cross-selling can increase revenue, driving business growth.
- Presents sales performance data, helping to assess the success of cross-selling efforts and refine approaches for better results.
Conclusion
In conclusion, this wireframe provides crucial insights into revenue generation, product relationships, and customer responses. By highlighting total cross-selling revenue, cross-sell rates, and correlations between products, it enables businesses to enhance their sales strategies. This template supports effective decision-making and helps identify opportunities for boosting revenue through targeted cross-selling efforts.