
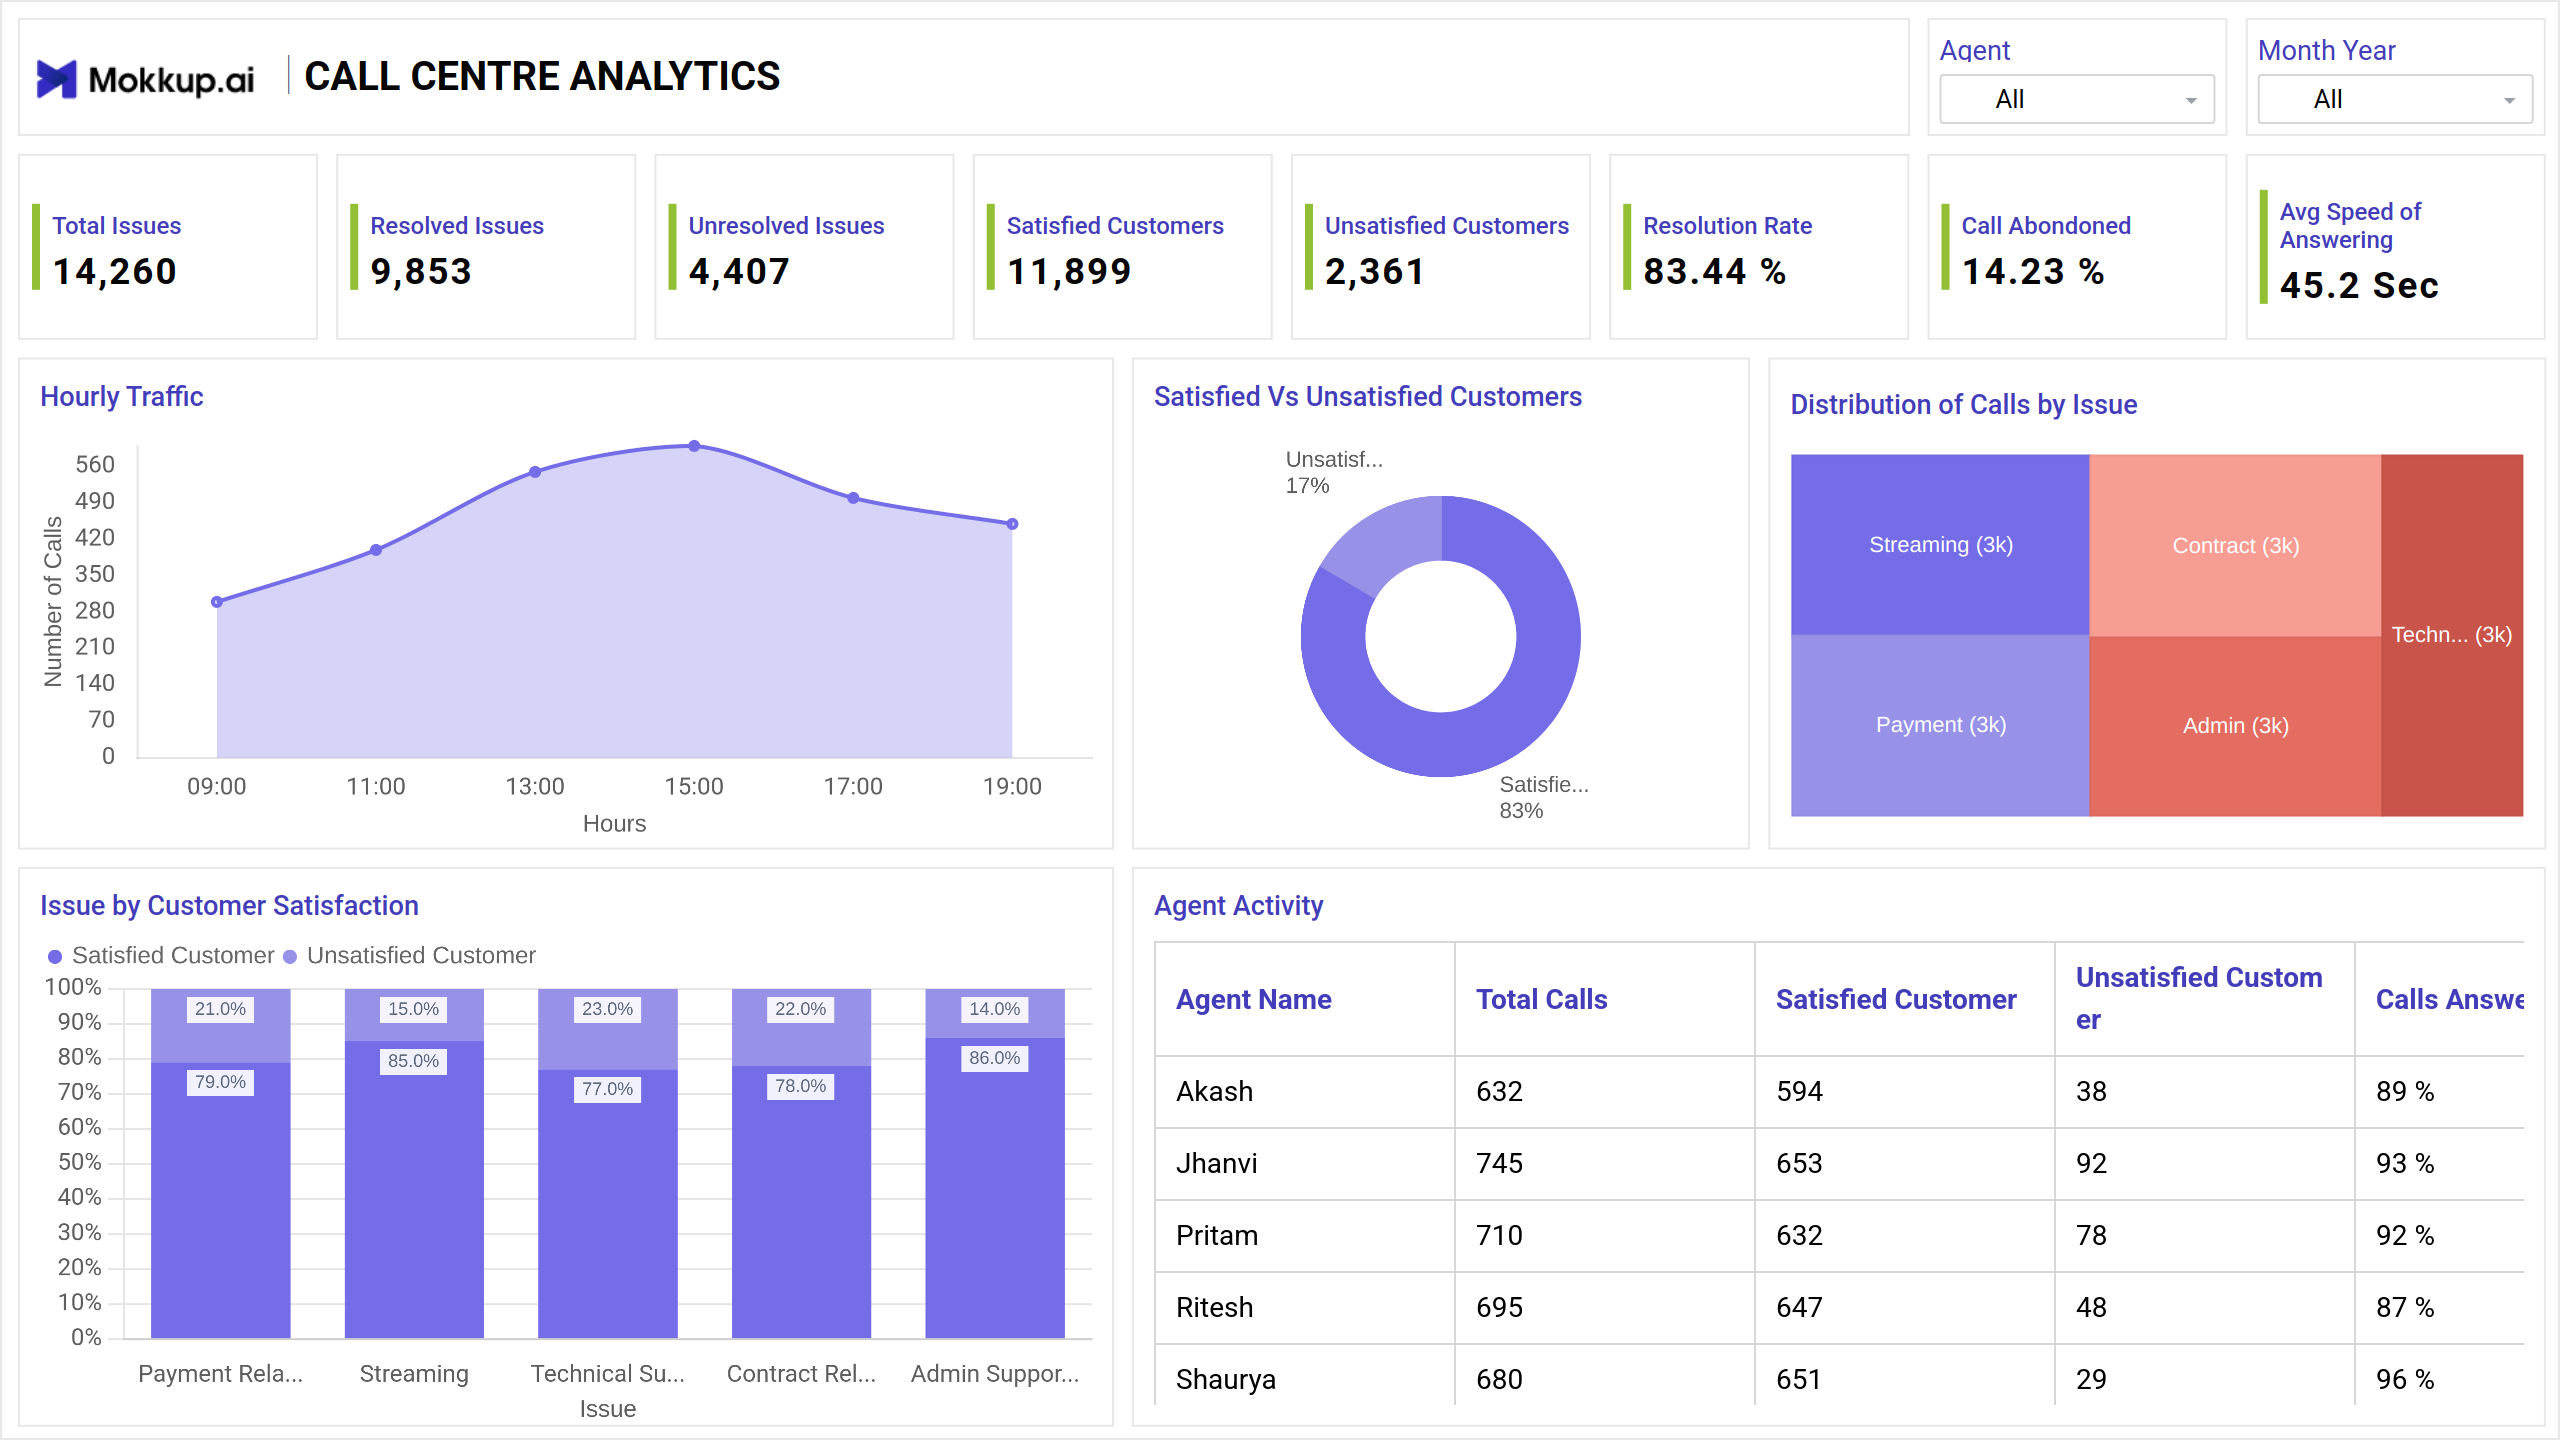
A call center overview dashboard template is a visual representation of key performance indicators (KPIs) that track the efficiency and effectiveness of call center operations. This screen offers a comprehensive overview of call center performance metrics, empowering businesses to optimize customer service operations. By analyzing the key indicators below, companies can identify areas for improvement and enhance overall efficiency.
Key Terms to Know
- Hourly Traffic: This is the number of calls the call center receives each hour.
- Satisfied vs. Unsatisfied Customers: This is the percentage of customers who are satisfied or unsatisfied with the call center's service.
- Distribution of Calls by Issue: This is the breakdown of calls by the type of issue that the customer is calling about.
- Issue by Customer Satisfaction: This is the breakdown of calls by the type of issue and the customer's satisfaction with the resolution.
- Agent Activity: This is the breakdown of the time agents spend on different tasks, such as answering calls, handling chats, and resolving issues.
Dashboard Template Insights
This dashboard wireframe is more than just presenting metrics; it's about empowering decision-makers with actionable insights. Some of the key achievements include:
- Track trends in call volume, handle time, and agent utilization to identify areas for optimization, leading to reduced costs and quicker resolutions.
- Monitor First Contact Resolution (FCR) rates, hold times, and customer feedback to pinpoint areas for improvement, ultimately driving happier customers.
- Identify emerging issues and trends before they escalate, allowing for proactive measures to mitigate impact and improve preparedness.
Conclusion
In conclusion, a call center overview dashboard effectively allows managers to monitor and improve call center operations. Overall, a call center overview dashboard is essential for any call center seeking to enhance its performance and provide excellent customer service.