
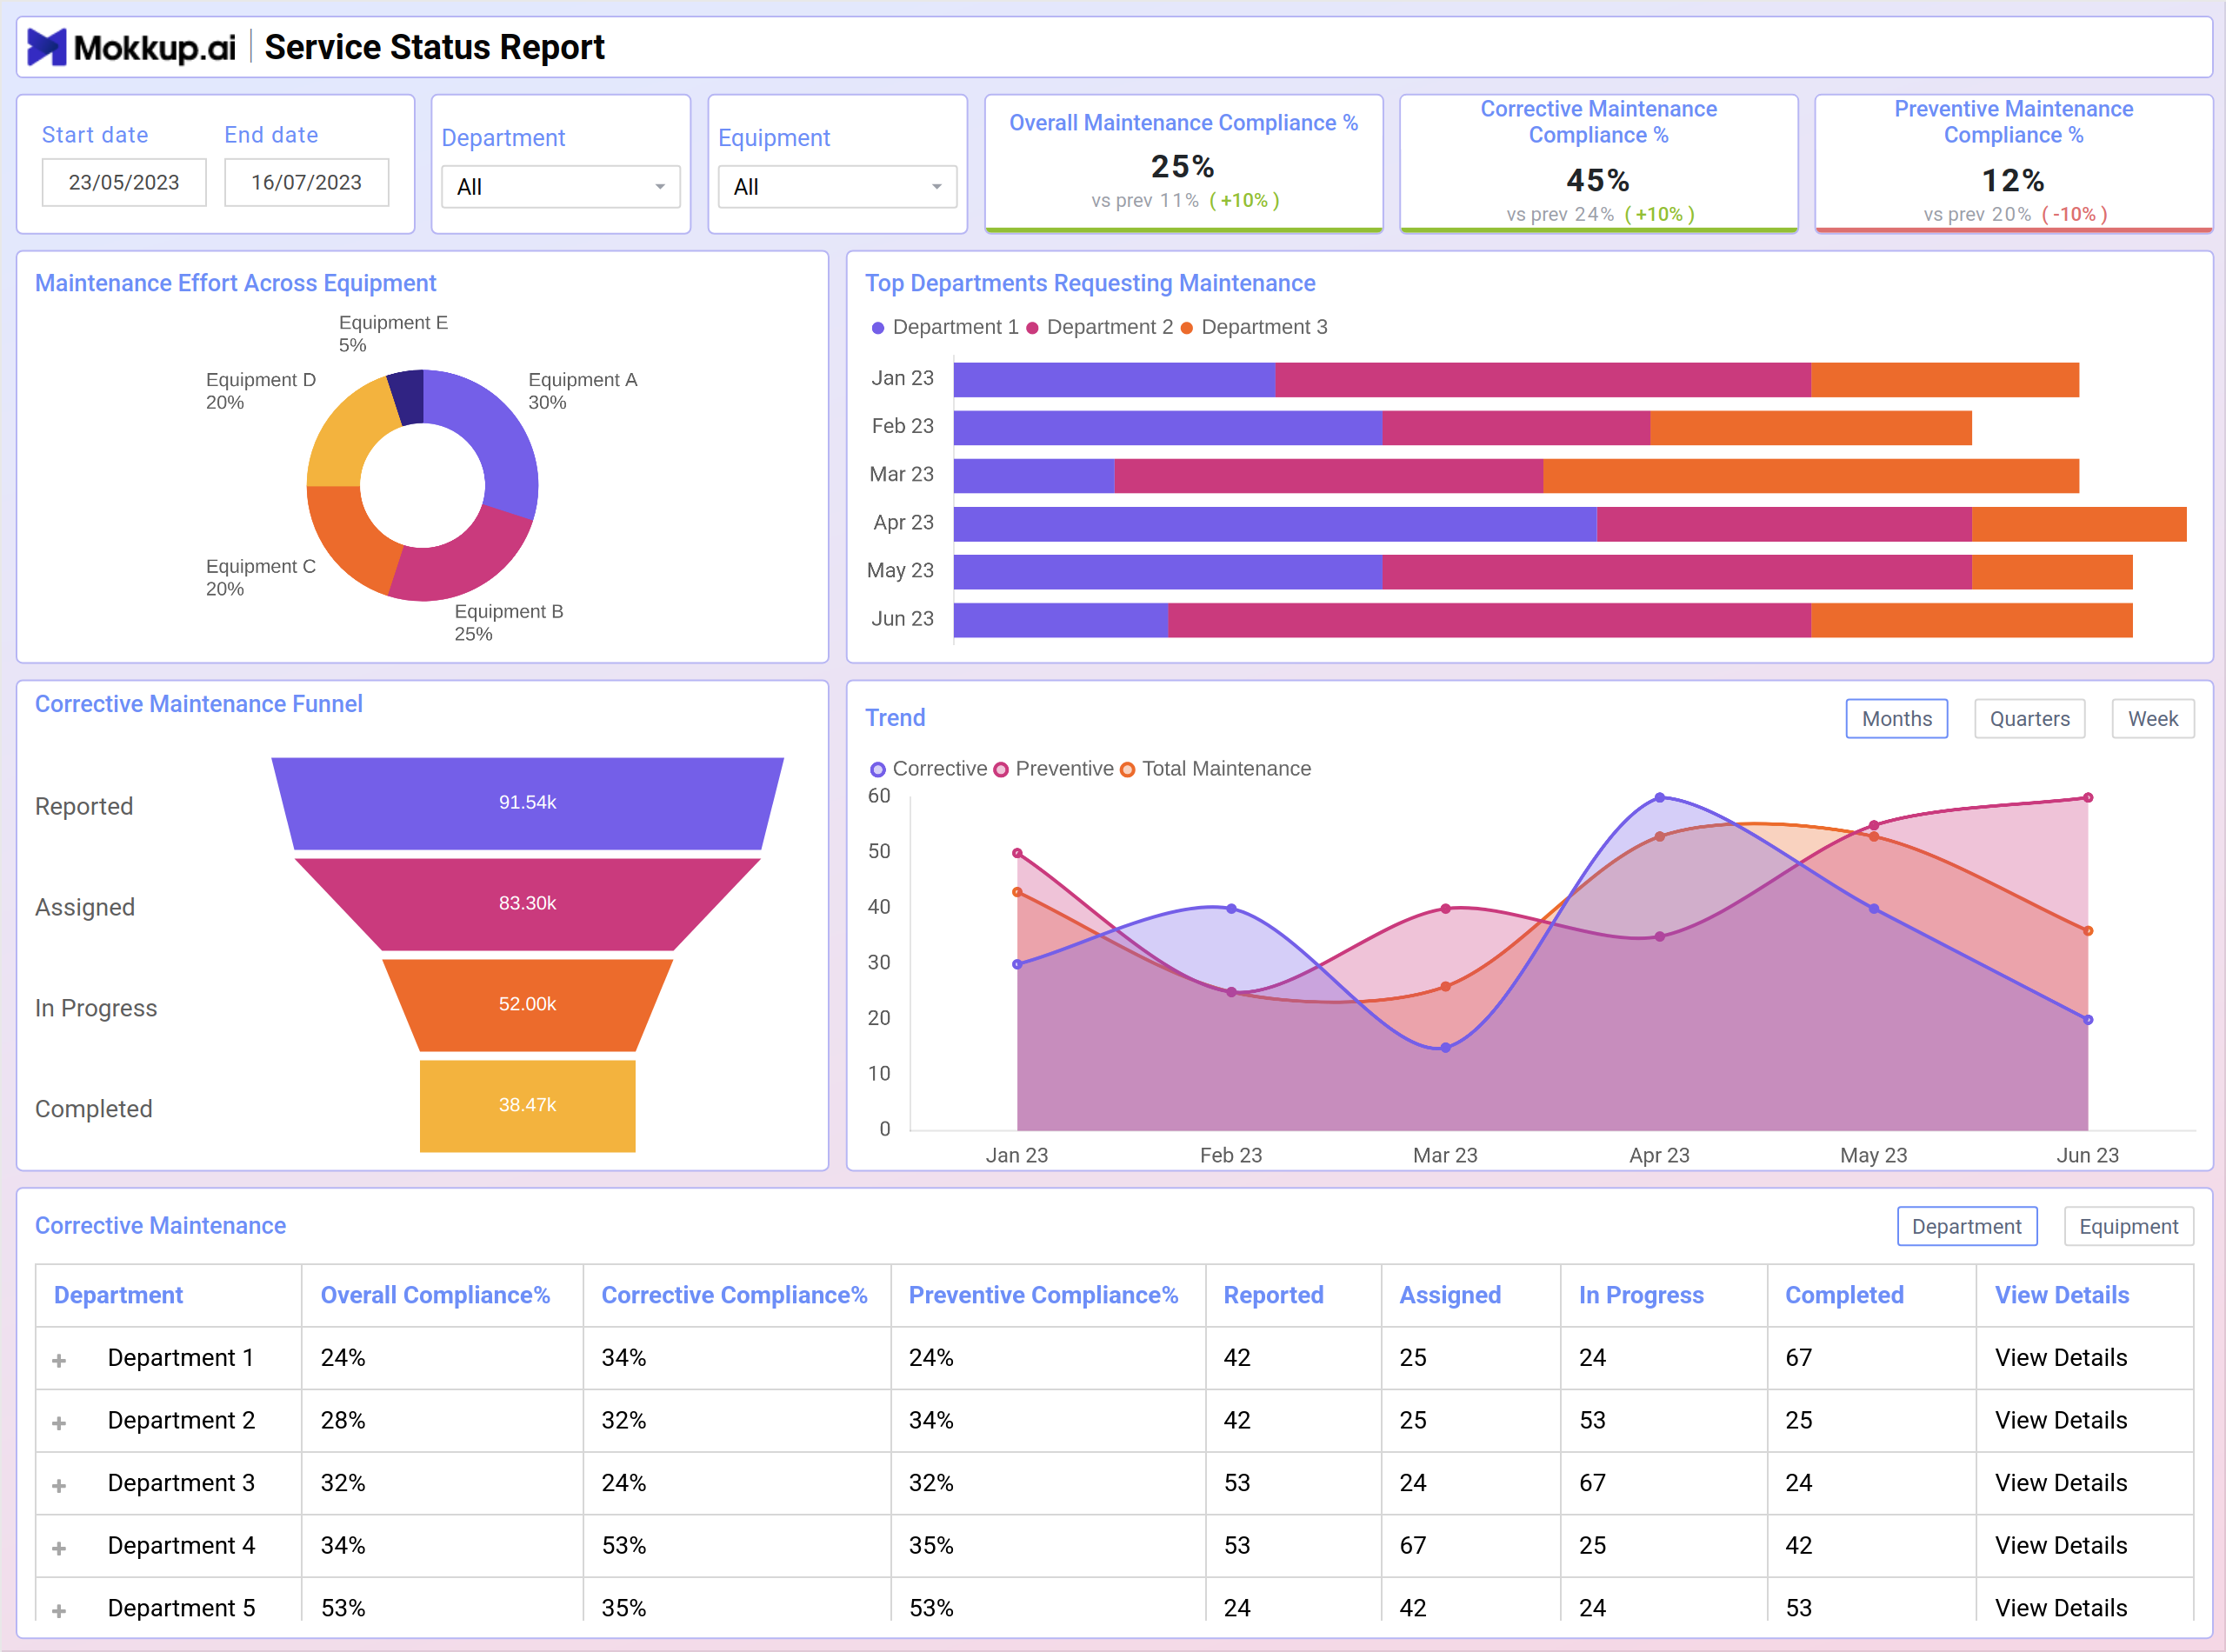
The service status report template offers a streamlined platform for managing maintenance operations. Users gain access to critical data such as equipment status, maintenance schedules, and repair histories. Designed for simplicity, it provides valuable insights into maintenance activities without unnecessary complexity. With this resource, maintenance teams can efficiently monitor equipment health and plan maintenance tasks to ensure smooth operations.
The dashboard wireframe comprises three screens: Maintenance Report, Corrective Maintenence Report and Equipment Family Report; each is explained briefly below.
Maintenance Report
The template provides a central location for users to monitor and manage maintenance activities. It offers a quick view of overall compliance, corrective and preventive maintenance trends, and maintenance requests by department. The dashboard also includes sections on equipment family distribution and a funnel chart depicting the corrective maintenance process. Users can view lists of departments and equipment families for further analysis.
Key Terms to Know
- Overall Maintenance Compliance %: Evaluates the percentage of maintenance tasks completed in adherence to schedules or standards.
- Corrective Maintenance Funnel: Visualizes the stages of corrective maintenance tasks from identification to resolution.
- Top Departments Requesting Maintanence: Identifies departments with the highest frequency of maintenance requests.
- Trend: Illustrates maintenance performance trends over time, aiding in predictive analysis and decision-making.
Department Based 1 | Corrective Maintenence Report
This view provides insights into corrective maintenance activities for each department. It displays metrics like total corrective requests, average resolution time, and most common issues, all segmented by department. The template also includes a bar chart showing the urgency distribution of corrective maintenance requests.
Key Terms to Know
- Total Corrective Requests: Indicates the overall count of corrective maintenance requests received.
- Avg. Resolution Time: Calculates the average time taken to resolve corrective maintenance issues.
- Open Requests: Displays the current number of open maintenance requests awaiting resolution.
- Most Common Issue: Identifies the prevalent issue requiring corrective maintenance.
- Monthly Requests Trend: Illustrates the trend in corrective maintenance requests over successive months.
- Urgency Distribution: Categorizes maintenance requests based on their urgency level for prioritization.
Equipment Family Report
This screen offers a comprehensive view of preventive maintenance tasks by equipment family. It showcases completion rates, average completion times, and trends over time. The template utilizes a circle graph to represent the completion percentage for each equipment family. A line graph depicts completion time trends, with completion time displayed on the y-axis and time on the x-axis. Additionally, the dashboard provides a table that breaks down planned tasks, completed tasks, and the change between the two for each equipment family.
Key Terms to Know
- Scheduled Tasks: Lists all planned preventive maintenance tasks along with their schedules.
- Avg. Completion Time: Calculates the average time taken to complete preventive maintenance tasks.
- Commonly Serviced Components: Identifies the components or equipment frequently serviced during preventive maintenance.
- Compliance Trends: Analyzes trends in preventive maintenance compliance over time to identify patterns and areas for improvement.
Dashboard Template Insights
This dashboard wireframe achieves significant milestones:
- Provides a comprehensive overview of preventive and corrective maintenance compliance, facilitating adherence to maintenance schedules and standards.
- Identifies commonly serviced components and top requesting departments, enabling proactive planning and allocation of resources.
- Analyzes maintenance trends and average completion times, aiding in performance evaluation and process refinement.
Conclusion
In conclusion, the service status report wireframe enhances maintenance operations and equipment reliability. By providing insights into compliance monitoring, resource allocation, & performance analysis, it empowers maintenance teams to streamline processes and improve overall efficiency. With its insights, it fosters continuous improvement and ensures the smooth functioning of facilities and equipment.