
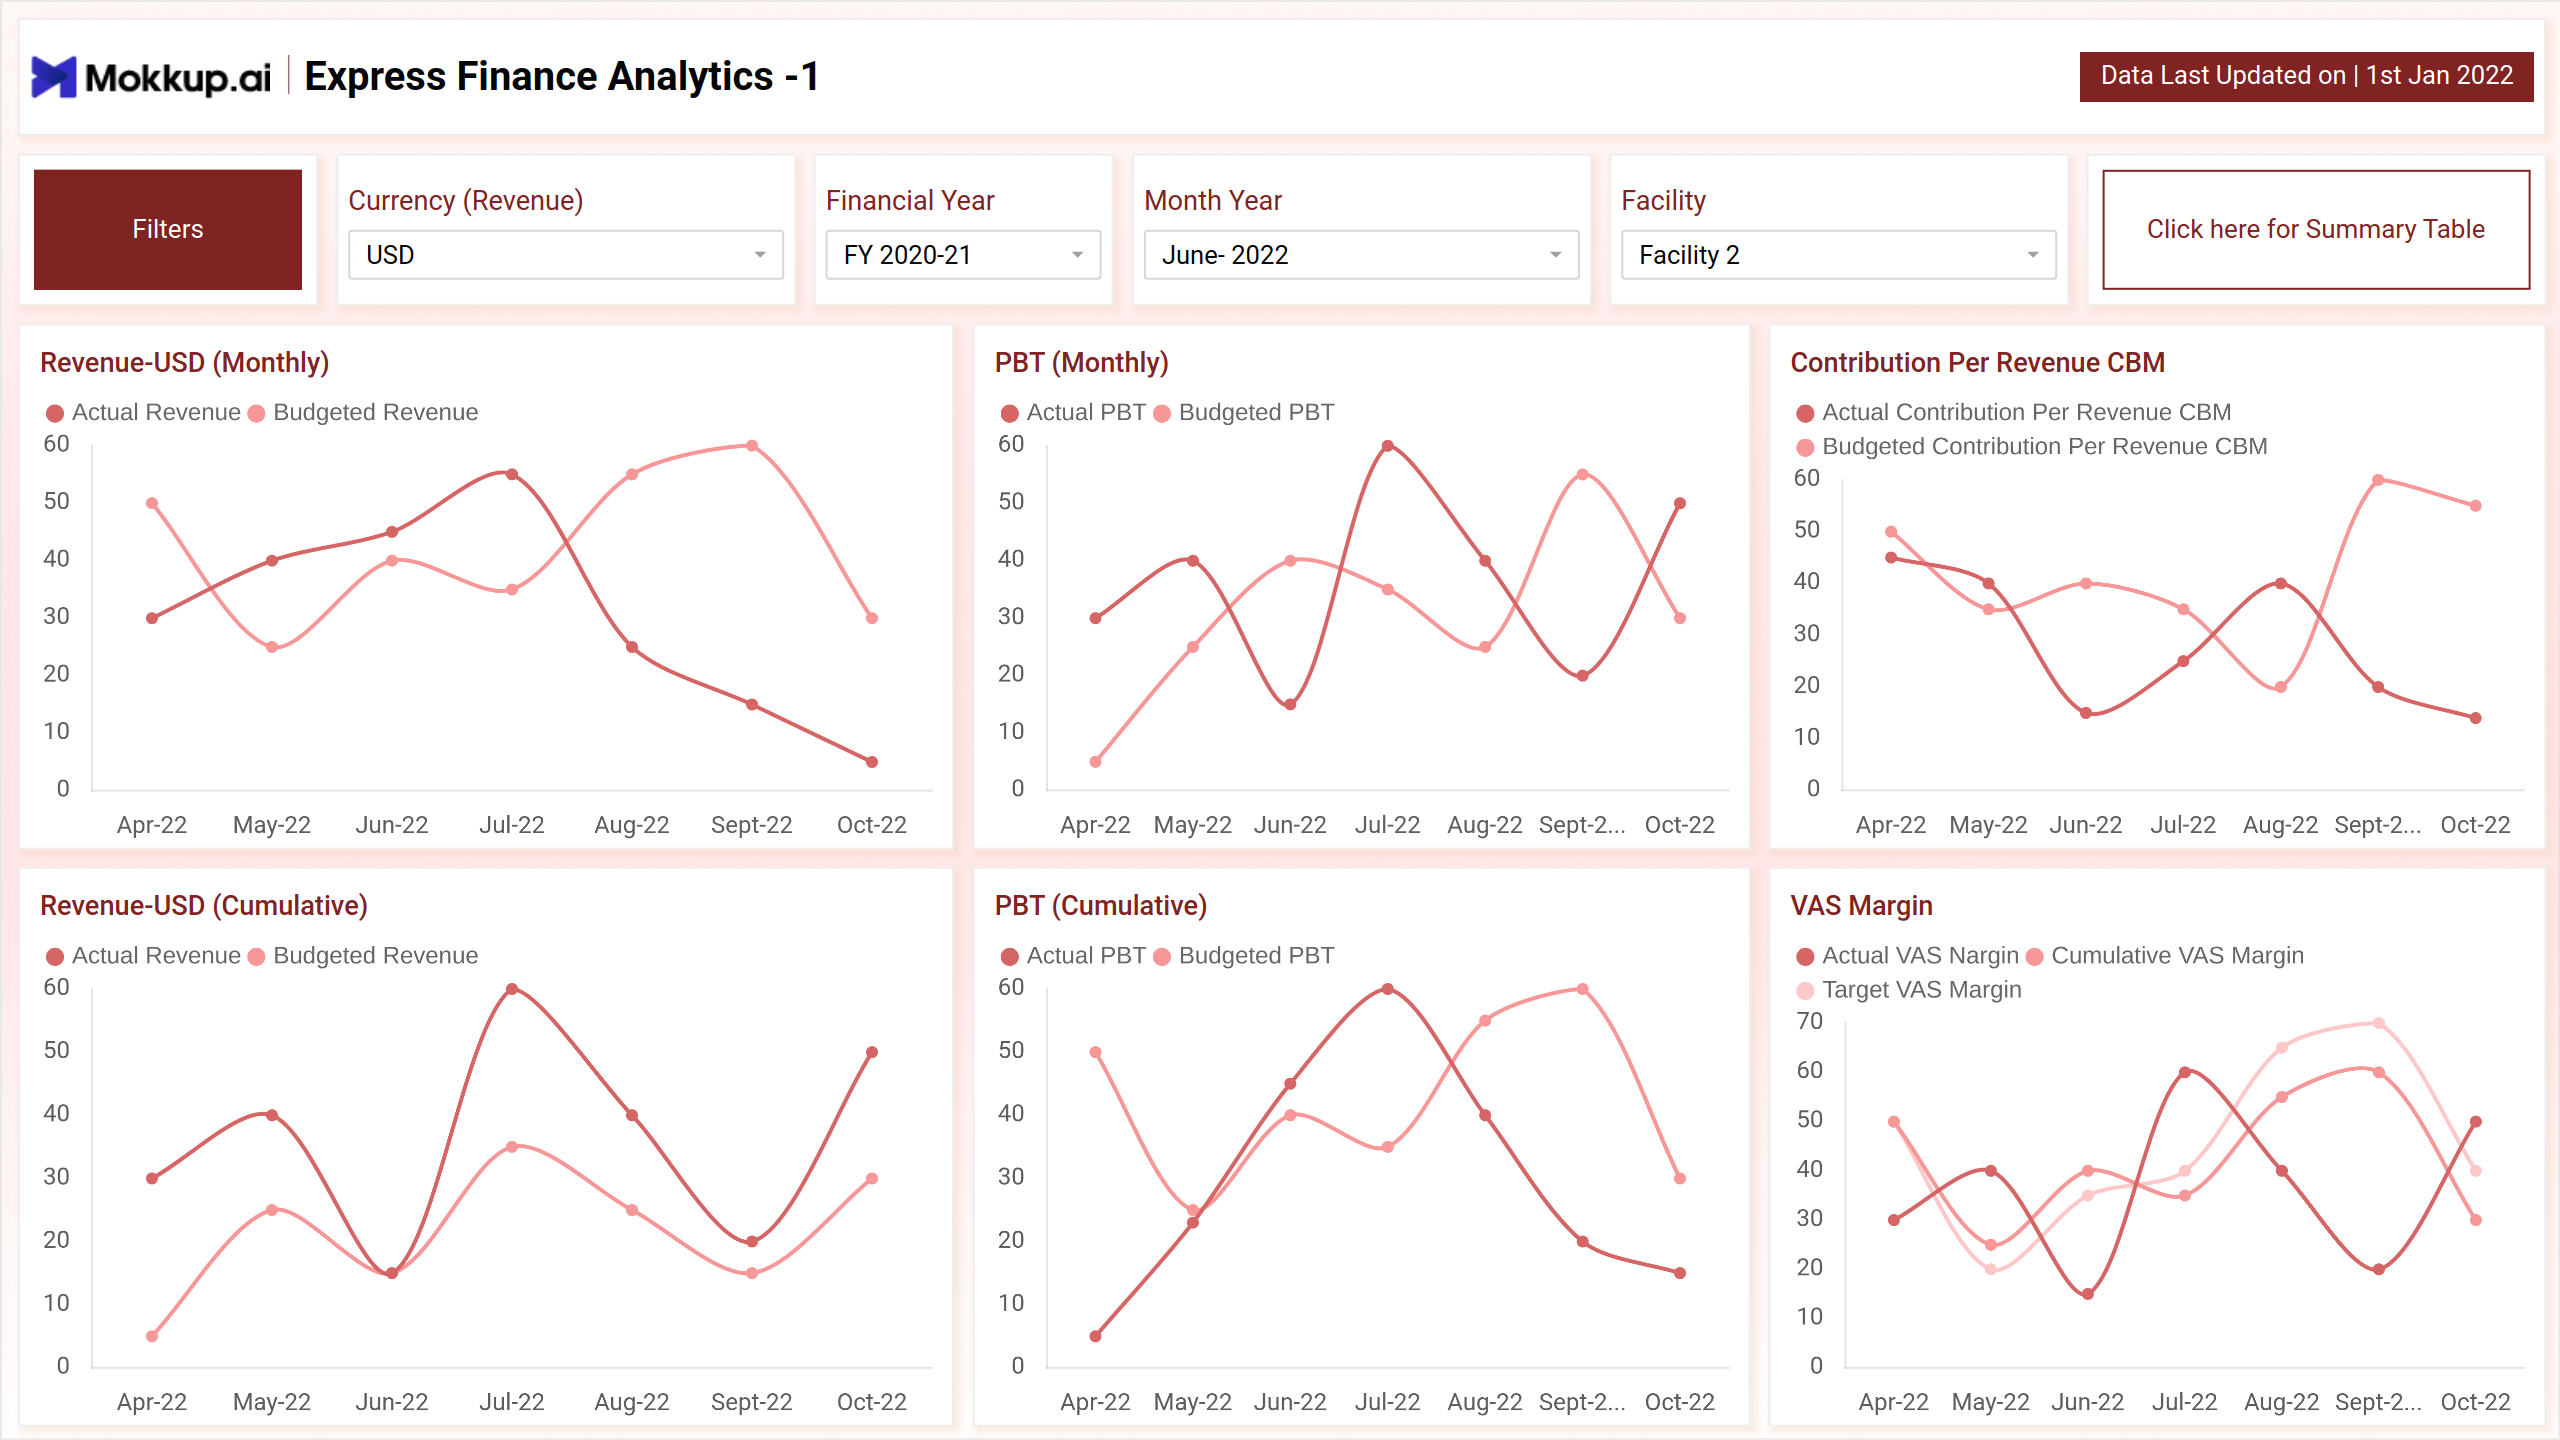
The Logistics Express Finance Analytics Dashboard template offers insights into key metrics like revenue, profitability, and cost trends, tailored to express finance services. In this ever-changing environment, users can enhance operational efficiency by maximizing financial performance and identifying growth prospects by utilizing predictive analytics.
Express Finance Analytics 1
The Express Analytics -1 gives a thorough rundown of all the financial data required to assess how well express finance operations are performing.
Key Terms to Know
Revenue Metrics -
- Monthly and Cumulative Revenue: It provides insights into the monthly and cumulative revenue generated by express finance services.
- Actual vs. Budgeted Revenue: Compares the actual revenue with the budgeted revenue to assess performance against financial targets.
Profit Before Tax -
- Monthly and Cumulative PBT: Indicates the monthly and cumulative Profit Before Tax generated by express finance services.
- Actual vs. Budgeted PBT: Compares the actual PBT with the budgeted PBT to evaluate financial performance.
Contribution Per Revenue CBM -
- Contribution Margin: Contribution Margin measures the proportion of revenue allocated to covering fixed costs and generating profit, comparing both actual and budgeted values to assess financial efficiency.
Express Finance Analytics 2
The 2nd screen provides a brief summary table that shows the actual and budgeted revenue amounts for the USD and LKR currencies, along with the total revenue in USD.
The table offers a clear snapshot of revenue performance over time, enabling finance professionals to track revenue trends, assess performance against budgeted targets, and make informed decisions to optimize financial strategies and achieve organizational goals.
Key Terms to Know
- Actual Revenue & Budgeted Revenue (USD & LKR): It provides actual and budgeted revenue values in United States Dollar (USD) & Sri Lankan Rupees (LKR), enabling a detailed analysis of revenue performance in the local currency.
Express Finance Analytics 3
The 3rd screen of the Express Finance Analytics Dashboard wireframe presents a comprehensive overview of operational efficiency and workforce development metrics.
Key Terms to Know
- Debtor Days: It measures the average number of days it takes for debtors to pay their outstanding invoices, helping in cash flow management and financial planning.
- Incident Days: Keeps track of the days that have operational incidents, which can be used to pinpoint problem areas and reduce delays.
- Operational Savings vs. Budgeted Savings (Monthly and Cumulative): Compares actual operational savings with budgeted savings on a monthly and cumulative basis, enabling cost control and financial performance monitoring.
- Training Hours Completion (Monthly and Cumulative): Displays actual and target training hours completion rates on a monthly and cumulative basis, ensuring workforce development goals are met and enhancing employee productivity.
Dashboard Template Insights
The dashboard wireframe provides a holistic view of essential metrics, enabling data-driven decision-making for improved financial and operational outcomes.
- The Express Finance Analytics template offers insights into financial performance, operational efficiency, and workforce development metrics tailored to express finance operations.
- With comprehensive views of revenue, profitability, cost trends, and workforce metrics, finance professionals can make informed decisions to drive profitability and operational excellence in the constantly changing express finance landscape.
Conclusion
The Express Finance Analytics Dashboard template offers a comprehensive view of vital financial and operational metrics. Leveraging data-driven insights and predictive analytics, it enables businesses to optimize performance, mitigate risks, and maintain a competitive edge in the logistics industry.