
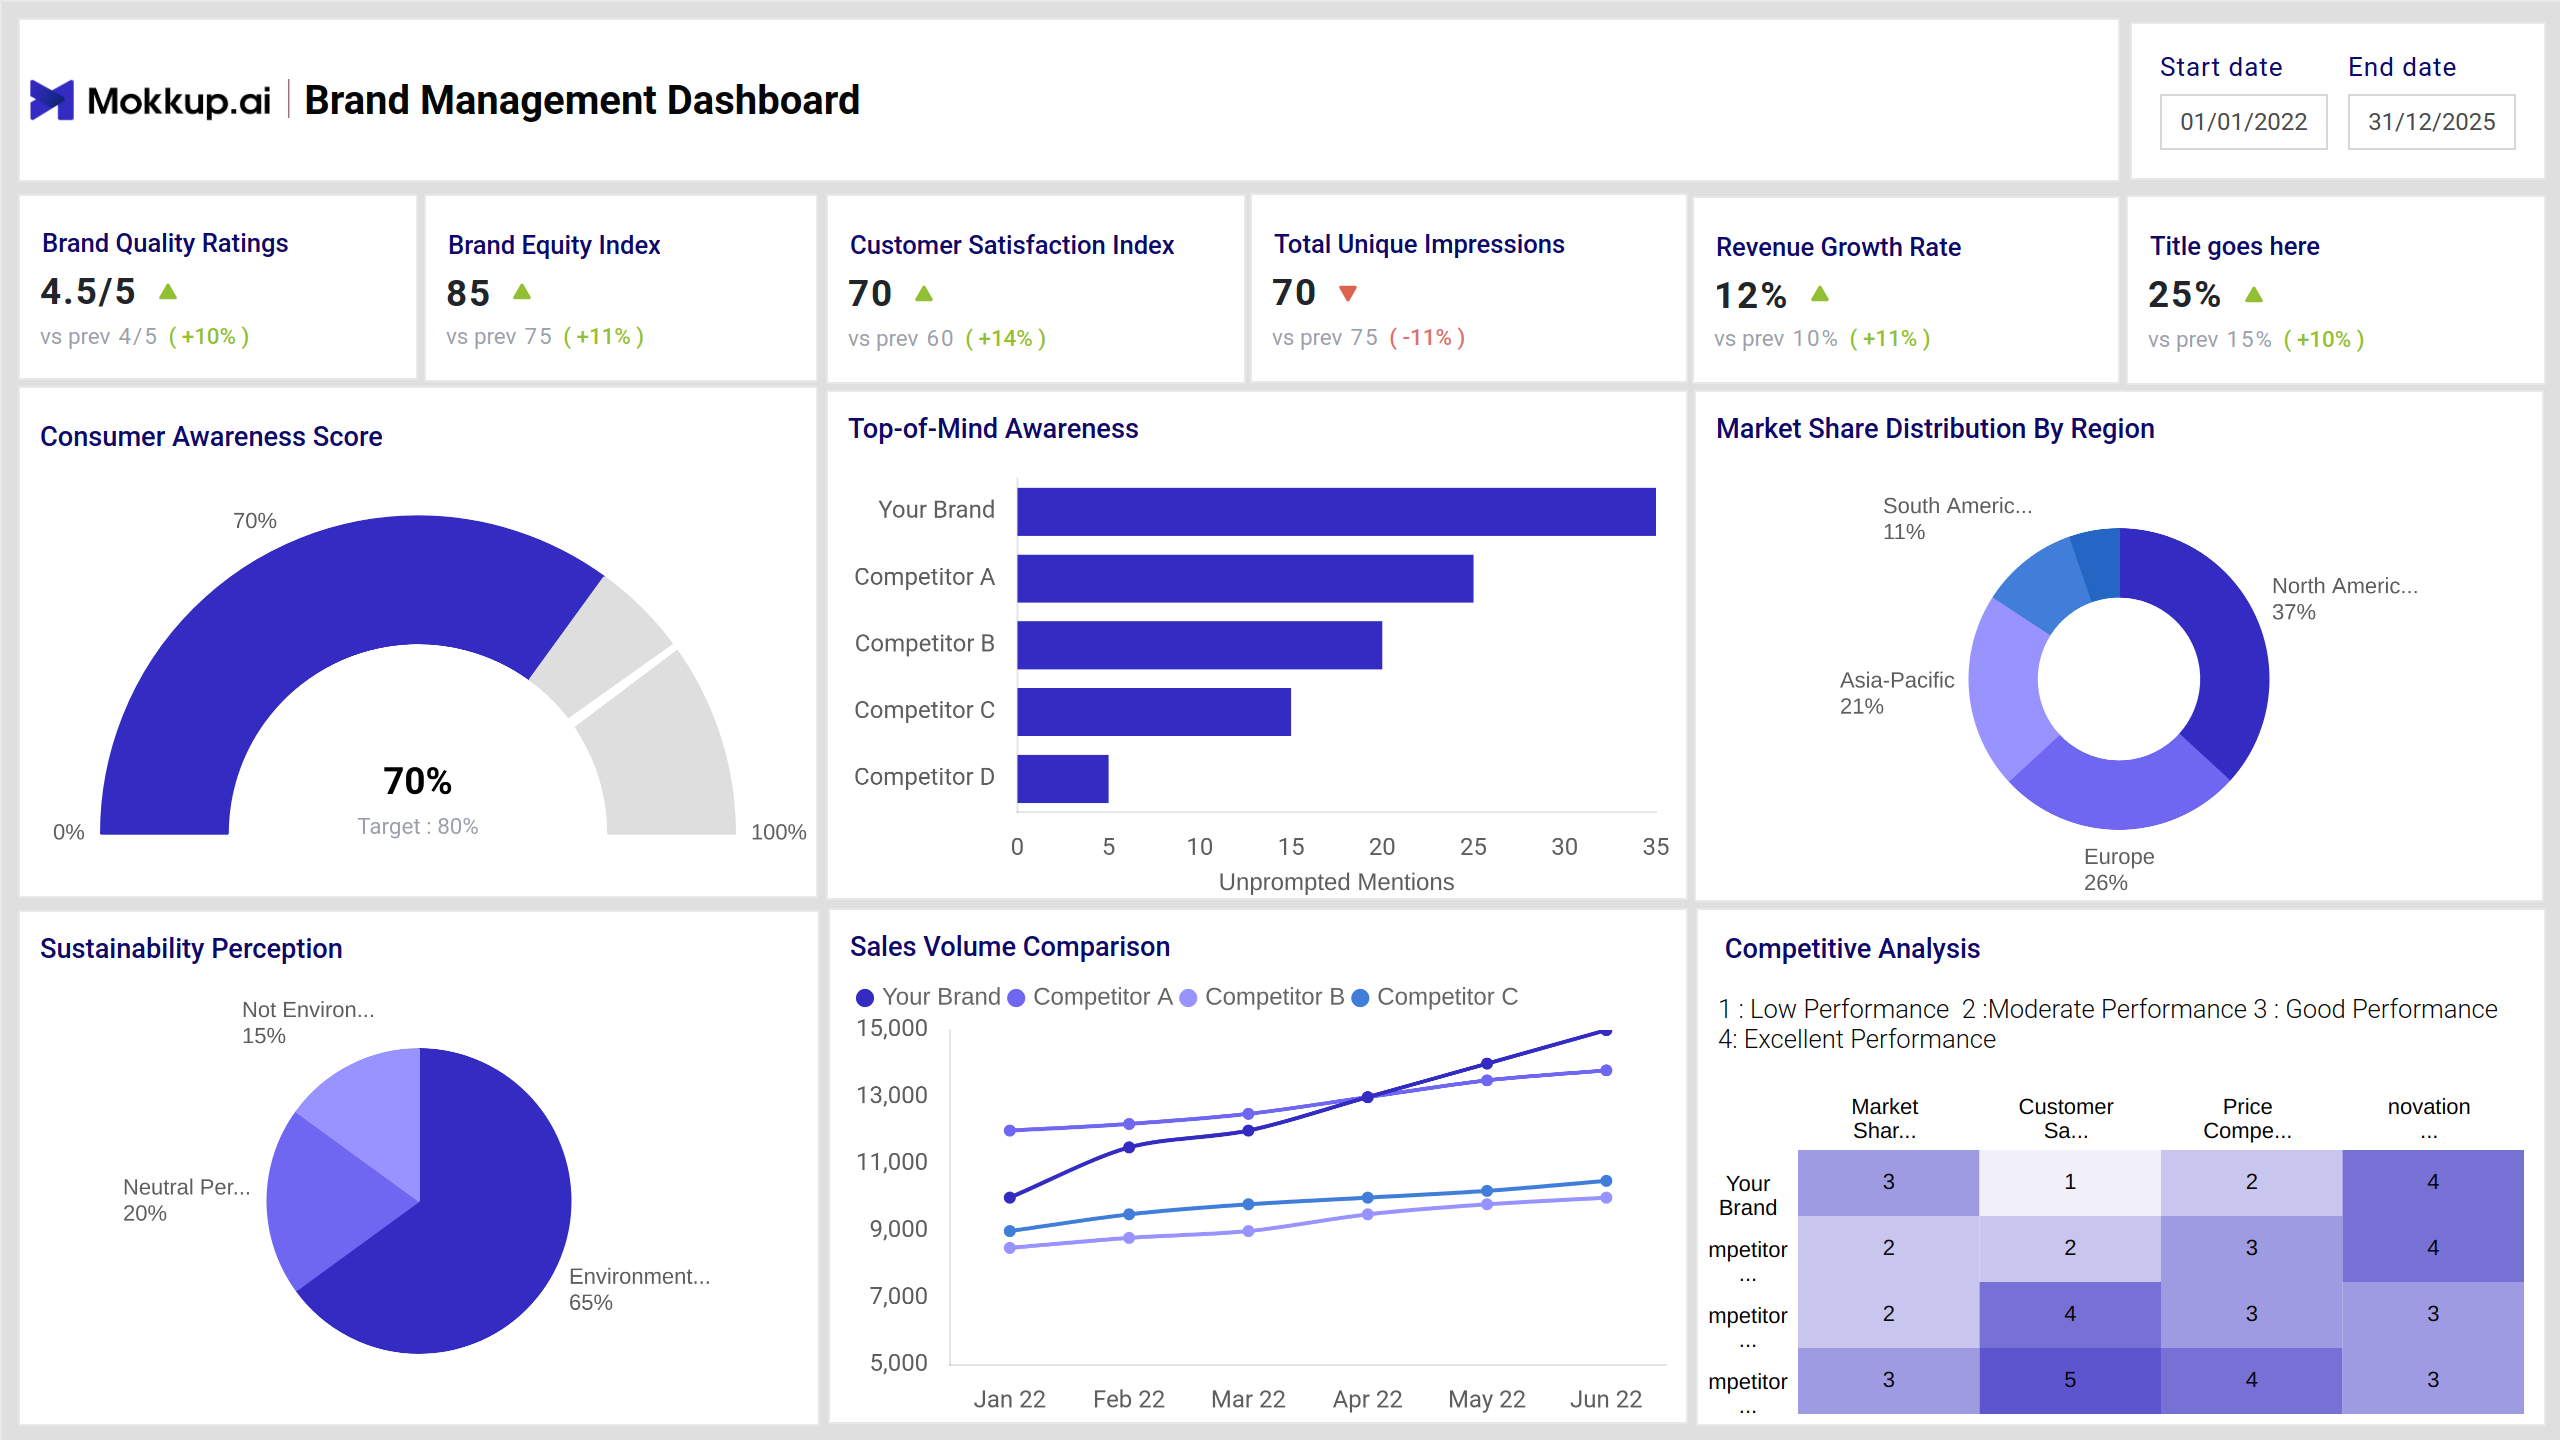
Brand Management Dashboard template helps businesses monitor key aspects of brand performance, including customer perception, engagement, and market reach. It provides insights into sentiment trends, social media impact, and brand consistency across channels. By tracking these metrics, businesses can refine their strategies, strengthen brand identity, and ensure a cohesive presence across different platforms.
Brand Performance Overview
This screen presents an overview of different aspects related to business performance, perception, and market positioning. It includes ratings, customer feedback, and competitive comparisons. Various visual elements highlight trends, strengths, and areas for improvement, helping businesses refine their approach and make informed decisions based on changing consumer and industry dynamics.
Key Terms to Know
- Brand Quality Ratings: Reflects how customers perceive product or service standards based on recent evaluations.
- Brand Equity Index: Measures overall strength and value in the market compared to previous assessments.
- Customer Satisfaction Index: Indicates the level of positive feedback and user experience improvements.
- Total Unique Impressions: Tracks reach and visibility, showing recent changes in audience engagement.
- Revenue Growth Rate: Displays business expansion over time with percentage-based trends.
- Consumer Awareness Score: Highlights how well the market recognizes the brand against set targets.
- Top-of-Mind Awareness: Compares unprompted brand mentions against competitors to assess visibility.
- Market Share Distribution by Region: Breaks down presence across different geographical areas.
- Sustainability Perception: Shows how audiences view environmental and social responsibility efforts.
- Sales Volume Comparison: Tracks business performance relative to key competitors over time.
- Competitive Analysis: Evaluates strengths across multiple dimensions against market rivals.
Customer Engagement
This view provides insights into various aspects of audience engagement, satisfaction, and business performance. It highlights customer sentiment, purchasing patterns, and areas for potential improvement. The visual elements compare trends over time, showing key areas of growth. Additionally, it presents an overview of strengths, challenges, and future opportunities for expansion.
Key Terms to Know
- Net Promoter Score: Measures customer loyalty by evaluating how likely they are to recommend the brand.
- Average Customer Review Score: Reflects the overall rating given by customers based on their experiences.
- Repeat Purchase Rate: Indicates the percentage of customers making multiple purchases.
- Feedback Response Rate: Tracks the percentage of customer feedback that receives a response.
- Customer Feedback Breakdown: Categorizes feedback into positive, neutral, and negative sentiments.
- Follower Growth: Displays trends in audience growth over time.
- Conversion Funnel: Represents the stages from awareness to final action.
- Traffic Sources Breakdown: Shows where website visitors originate from, including direct, social, and organic channels.
- Engagement by Content Type: Compares interactions (likes, shares, comments) across different content formats.
- SWOT Analysis: Outlines key strengths, weaknesses, opportunities, and threats for the brand and competitors.
Dashboard Template Insights
Here are the key insights the dashboard wireframe provides:
- The dashboard provides a breakdown of customer feedback, helping identify areas for improvement.
- It highlights which content formats drive the most interactions, aiding in content strategy.
- Trends in audience growth and purchase patterns offer insights into brand expansion.
- SWOT analysis and conversion trends help assess brand competitiveness and opportunities.
Conclusion
This dashboard wireframe provides a clear snapshot of brand perception, customer engagement, and market positioning. With insights into audience growth, feedback trends, and content performance, it helps refine strategies for stronger connections and improved conversions. A well-rounded tool for tracking and enhancing overall brand impact.