
What is a Boarding School Executive Performance Dashboard?
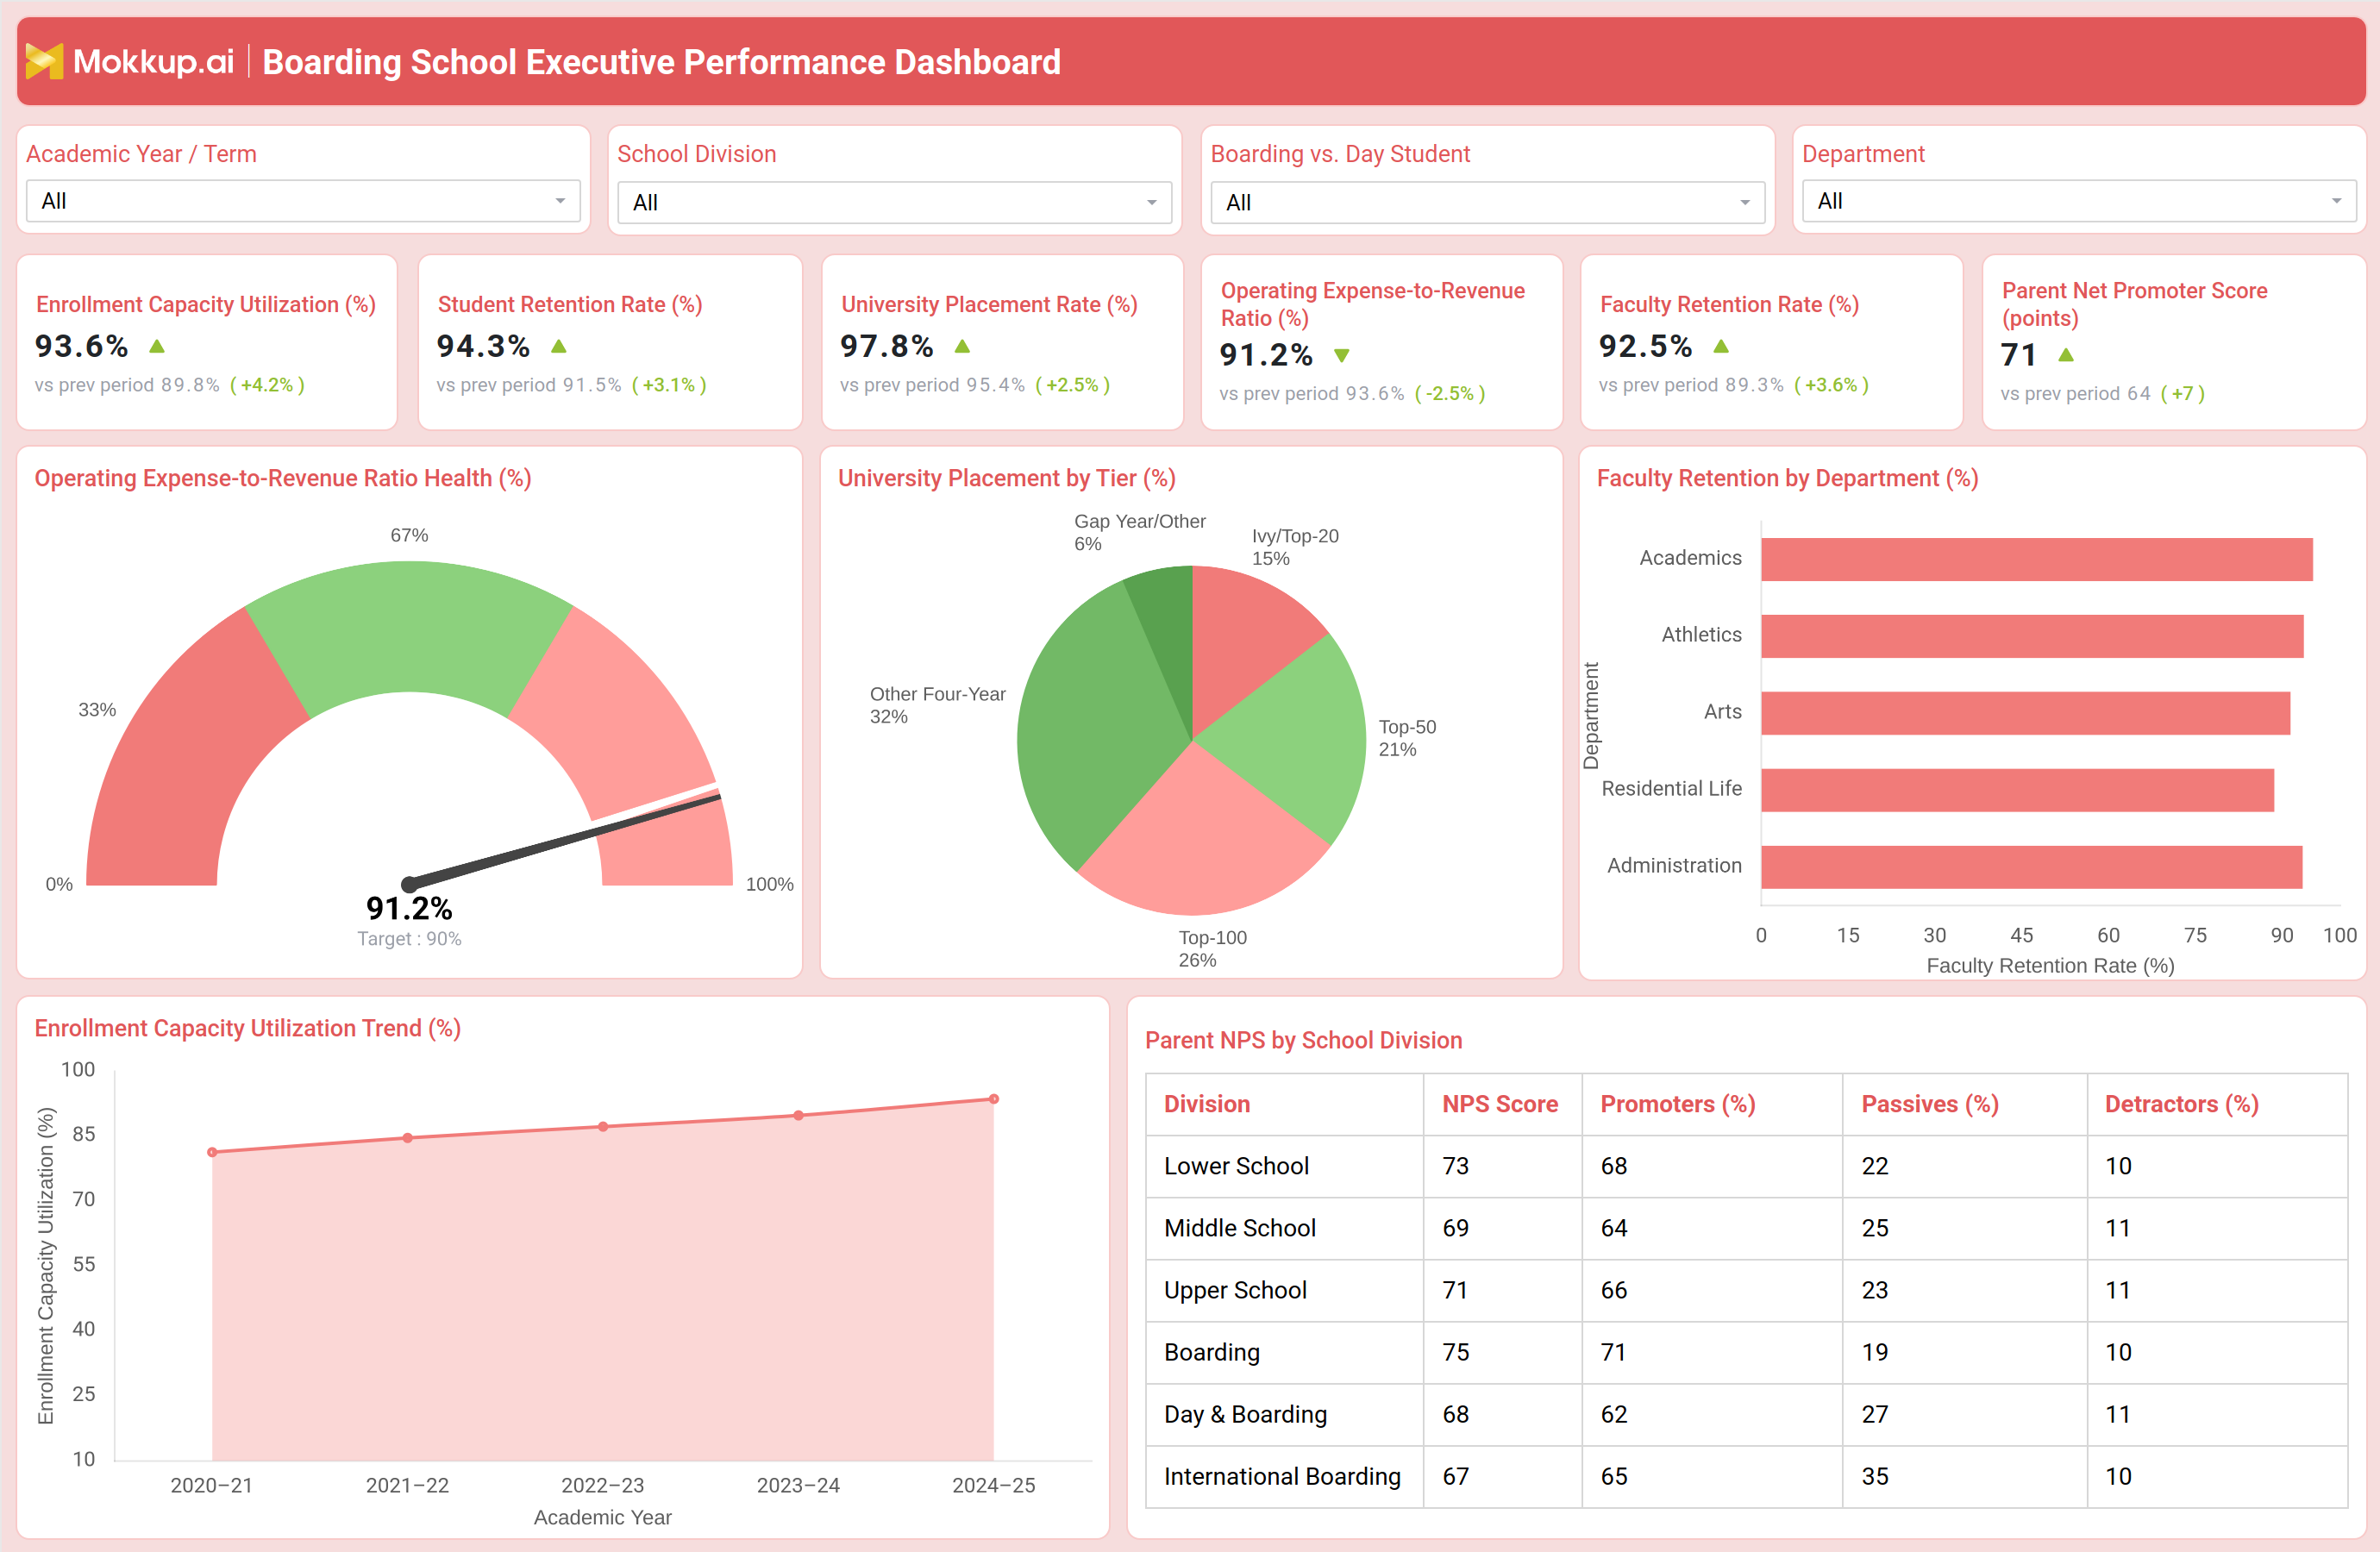
The Boarding School Executive Performance Dashboard is a wireframe template built for school leadership teams who need one consolidated view of enrollment, academics, staffing, and financial health across a boarding institution. It brings together enrollment capacity, student retention, university placement outcomes, faculty retention, operating cost pressure, and parent sentiment on a single screen, replacing the separate spreadsheets that admissions, academics, HR, and finance offices typically maintain in isolation. Heads of school, boards of trustees, and division directors rely on this boarding school executive performance dashboard to compare Lower School, Middle School, Upper School, Boarding, Day & Boarding, and International Boarding divisions side by side, filtered by academic year, school division, boarding versus day status, or department. Schools that need an enrollment capacity utilization rate tracking tool alongside academic and financial indicators can use this single template instead of assembling data from separate systems.
How to Create a Boarding School Executive Performance Dashboard
You don't need to build your report from scratch—just start with a ready-to-use dashboard template from Mokkup. Add in your data and export it however you like. Here's how to do it:
1. Create or Log in to Your Mokkup Account
Start by signing up on Mokkup.ai using your email. If you already have an account, just log in, and you'll be good to go.
2. Choose and Customize Your Dashboard Template
Find the Boarding School Executive Performance Dashboard template in the Templates section. Use the drag-and-drop editor to adjust KPIs, edit filters, or add elements based on your data.
3. Export to Your BI Tool
Once your dashboard wireframe is ready, use the BI Tool Export feature to send it directly to Power BI or Tableau for further analysis and enhancements. You can also download the dashboard as a PDF, PNG, or JPEG, embed it on a platform, or invite your team to collaborate.
Note: This is a Pro template. You'll need a Pro subscription on Mokkup to use and customize this dashboard wireframe. Upgrade anytime to unlock full access.
Boarding School Executive Performance Dashboard Example
A head of school or academic director typically opens the boarding school executive performance dashboard ahead of a board meeting or leadership review, looking to understand whether the institution is on track across enrollment, academics, staffing, and finance at once. Rather than requesting separate updates from admissions, the registrar, HR, and finance, they scan one screen to see where performance is strong and where a division or department needs attention. From there, leadership can identify whether enrollment capacity is being filled efficiently enough to support the operating budget, and whether that pace is improving or slipping against the prior period. They can assess how student retention and faculty retention are trending together, since losing staff and losing students often point to the same underlying culture or workload issues.
University placement outcomes let academic leaders judge whether the curriculum and college counseling program are delivering results at the tiers families expect, while the operating expense-to-revenue ratio tells the business office whether spending discipline is keeping pace with revenue growth. Filtering by school division or by boarding versus day status lets directors isolate whether a particular division is dragging down an otherwise healthy institution-wide number. Parent Net Promoter Score, which doubles as parent net promoter score monitoring for schools, gives leadership an early signal of family satisfaction before it shows up in re-enrollment decisions. Taken together, the dashboard helps a boarding school leadership team prioritize where to invest, where to intervene, and what to report to the board without waiting on multiple departments to compile separate updates.
How to Analyze Data in a Boarding School Executive Performance Dashboard
Here is how you can analyze data from this dashboard:
- Use this enrollment capacity utilization rate tracking tool to confirm admissions is filling available seats fast enough to support the operating budget.
- Compare student retention rate against faculty retention rate to catch culture or workload issues before they affect enrollment.
- Apply university placement rate monitoring for boarding schools to compare Ivy/Top-20, Top-50, and Top-100 outcomes by tier.
- Filter faculty retention by department to identify which teams need retention support first.
- Track the operating expense-to-revenue ratio gauge against its target to catch cost pressure before it erodes margin.
- Review Parent Net Promoter Score and the promoter, passive, and detractor mix by school division to find where family satisfaction is lagging.
- Use the Academic Year/Term, School Division, Boarding vs. Day Student, and Department filters to isolate trends for a single cohort or campus.
Benefits of a Boarding School Executive Performance Dashboard
The following are the benefits of using this dashboard:
- Gives heads of school and boards a single executive view instead of separate admissions, academic, HR, and finance reports.
- Surfaces faculty retention rate analysis by department so leadership can act on staffing risk early.
- Supports university placement rate monitoring for boarding schools without waiting on a separate college counseling report.
- Turns the operating expense to revenue ratio tracking dashboard into a shared reference for the business office and the board.
- Flags enrollment capacity and retention trends before they turn into a budget shortfall.
- Helps division leaders benchmark Lower School, Middle School, Upper School, Boarding, and International Boarding performance against each other.
- Reduces the manual work of assembling board-meeting updates from multiple departments.
KPIs to Track in a Boarding School Executive Performance Dashboard
Key Performance Indicators (KPIs) are the measurable values leadership tracks on the boarding school executive performance dashboard to judge whether enrollment, academics, staffing, and finances are performing as planned; Enrollment Capacity Utilization Rate (%) measures the share of available student seats currently filled.
- Student Retention Rate (%) - the percentage of enrolled students who continue at the school from one academic year to the next.
- University Placement Rate (%) - the percentage of graduating students placed into a university, tracked further by tier across Ivy/Top-20, Top-50, Top-100, Other Four-Year, and Gap Year/Other outcomes.
- Operating Expense-to-Revenue Ratio (%) - operating expenses as a percentage of revenue against a target; this operating expense to revenue ratio tracking dashboard view flags the ratio the moment it drifts past target.
- Faculty Retention Rate (%) - the percentage of faculty retained year over year, viewed through faculty retention rate analysis by department across Academics, Athletics, Arts, Residential Life, and Administration.
- Parent Net Promoter Score - a parent net promoter score monitoring for schools metric that measures family loyalty on a promoter-to-detractor scale.
Frequently Asked Questions
1. What data does the Boarding School Executive Performance Dashboard track?
It tracks enrollment capacity utilization, student and faculty retention, university placement outcomes, the operating expense-to-revenue ratio, and Parent Net Promoter Score. Filters let leadership break these down by academic year, school division, boarding versus day status, and department.
2. Does it include parent feedback tracking?
Yes. The dashboard functions as parent net promoter score monitoring for schools, showing the overall score plus the promoter, passive, and detractor mix by division. This helps leadership catch satisfaction issues before they affect re-enrollment.
3. Can I customize this template with our school's own data?
Yes. Add your data in Mokkup's drag-and-drop editor, adjust KPIs and filters as needed, then export to Power BI, Tableau, PDF, PNG, or JPEG. A Pro subscription is required to customize this template.