
The managerial dashboard provides an overview on the management of inventory, production, and machinery. These templates are used by the chief managers of the engineering departments for the following purposes:
- For managing spare parts inventory and,
- For analyzing overall machinery and worklog status.
Screen 1: Spare Parts Inventory Management
It displays the amount of inventory consumed by departments, provides usage trends and status updates, highlights commonly used spare parts, and identifies products that are in short supply.
Key Terms to consider:
- Inventory units: Represents the total count of items available in stock, aiding in resource management and replenishment.
- Inventory value: Quantifies the total monetary worth of inventory on hand, guiding financial planning and budget allocation.
- Total machines: Counts the number of machines or equipment in inventory, providing insights into asset management and maintenance needs.
- Inventory used by department: Tracks inventory usage across different departments, facilitating departmental budgeting and resource allocation.
- Inventory status: Indicates the current condition or availability of inventory items, informing decision-making regarding procurement and restocking.
- Usage trends: Analyzes patterns and trends in inventory usage over time, guiding inventory management strategies and forecasting future needs.
- Top 10 most used spare parts: Identifies the most frequently utilized spare parts, enabling proactive inventory management and optimization of stock levels.
- Needed product: Provides details on required products, including spare part names, current quantities, required quantities, and stock statuses, aiding in efficient inventory replenishment and management.
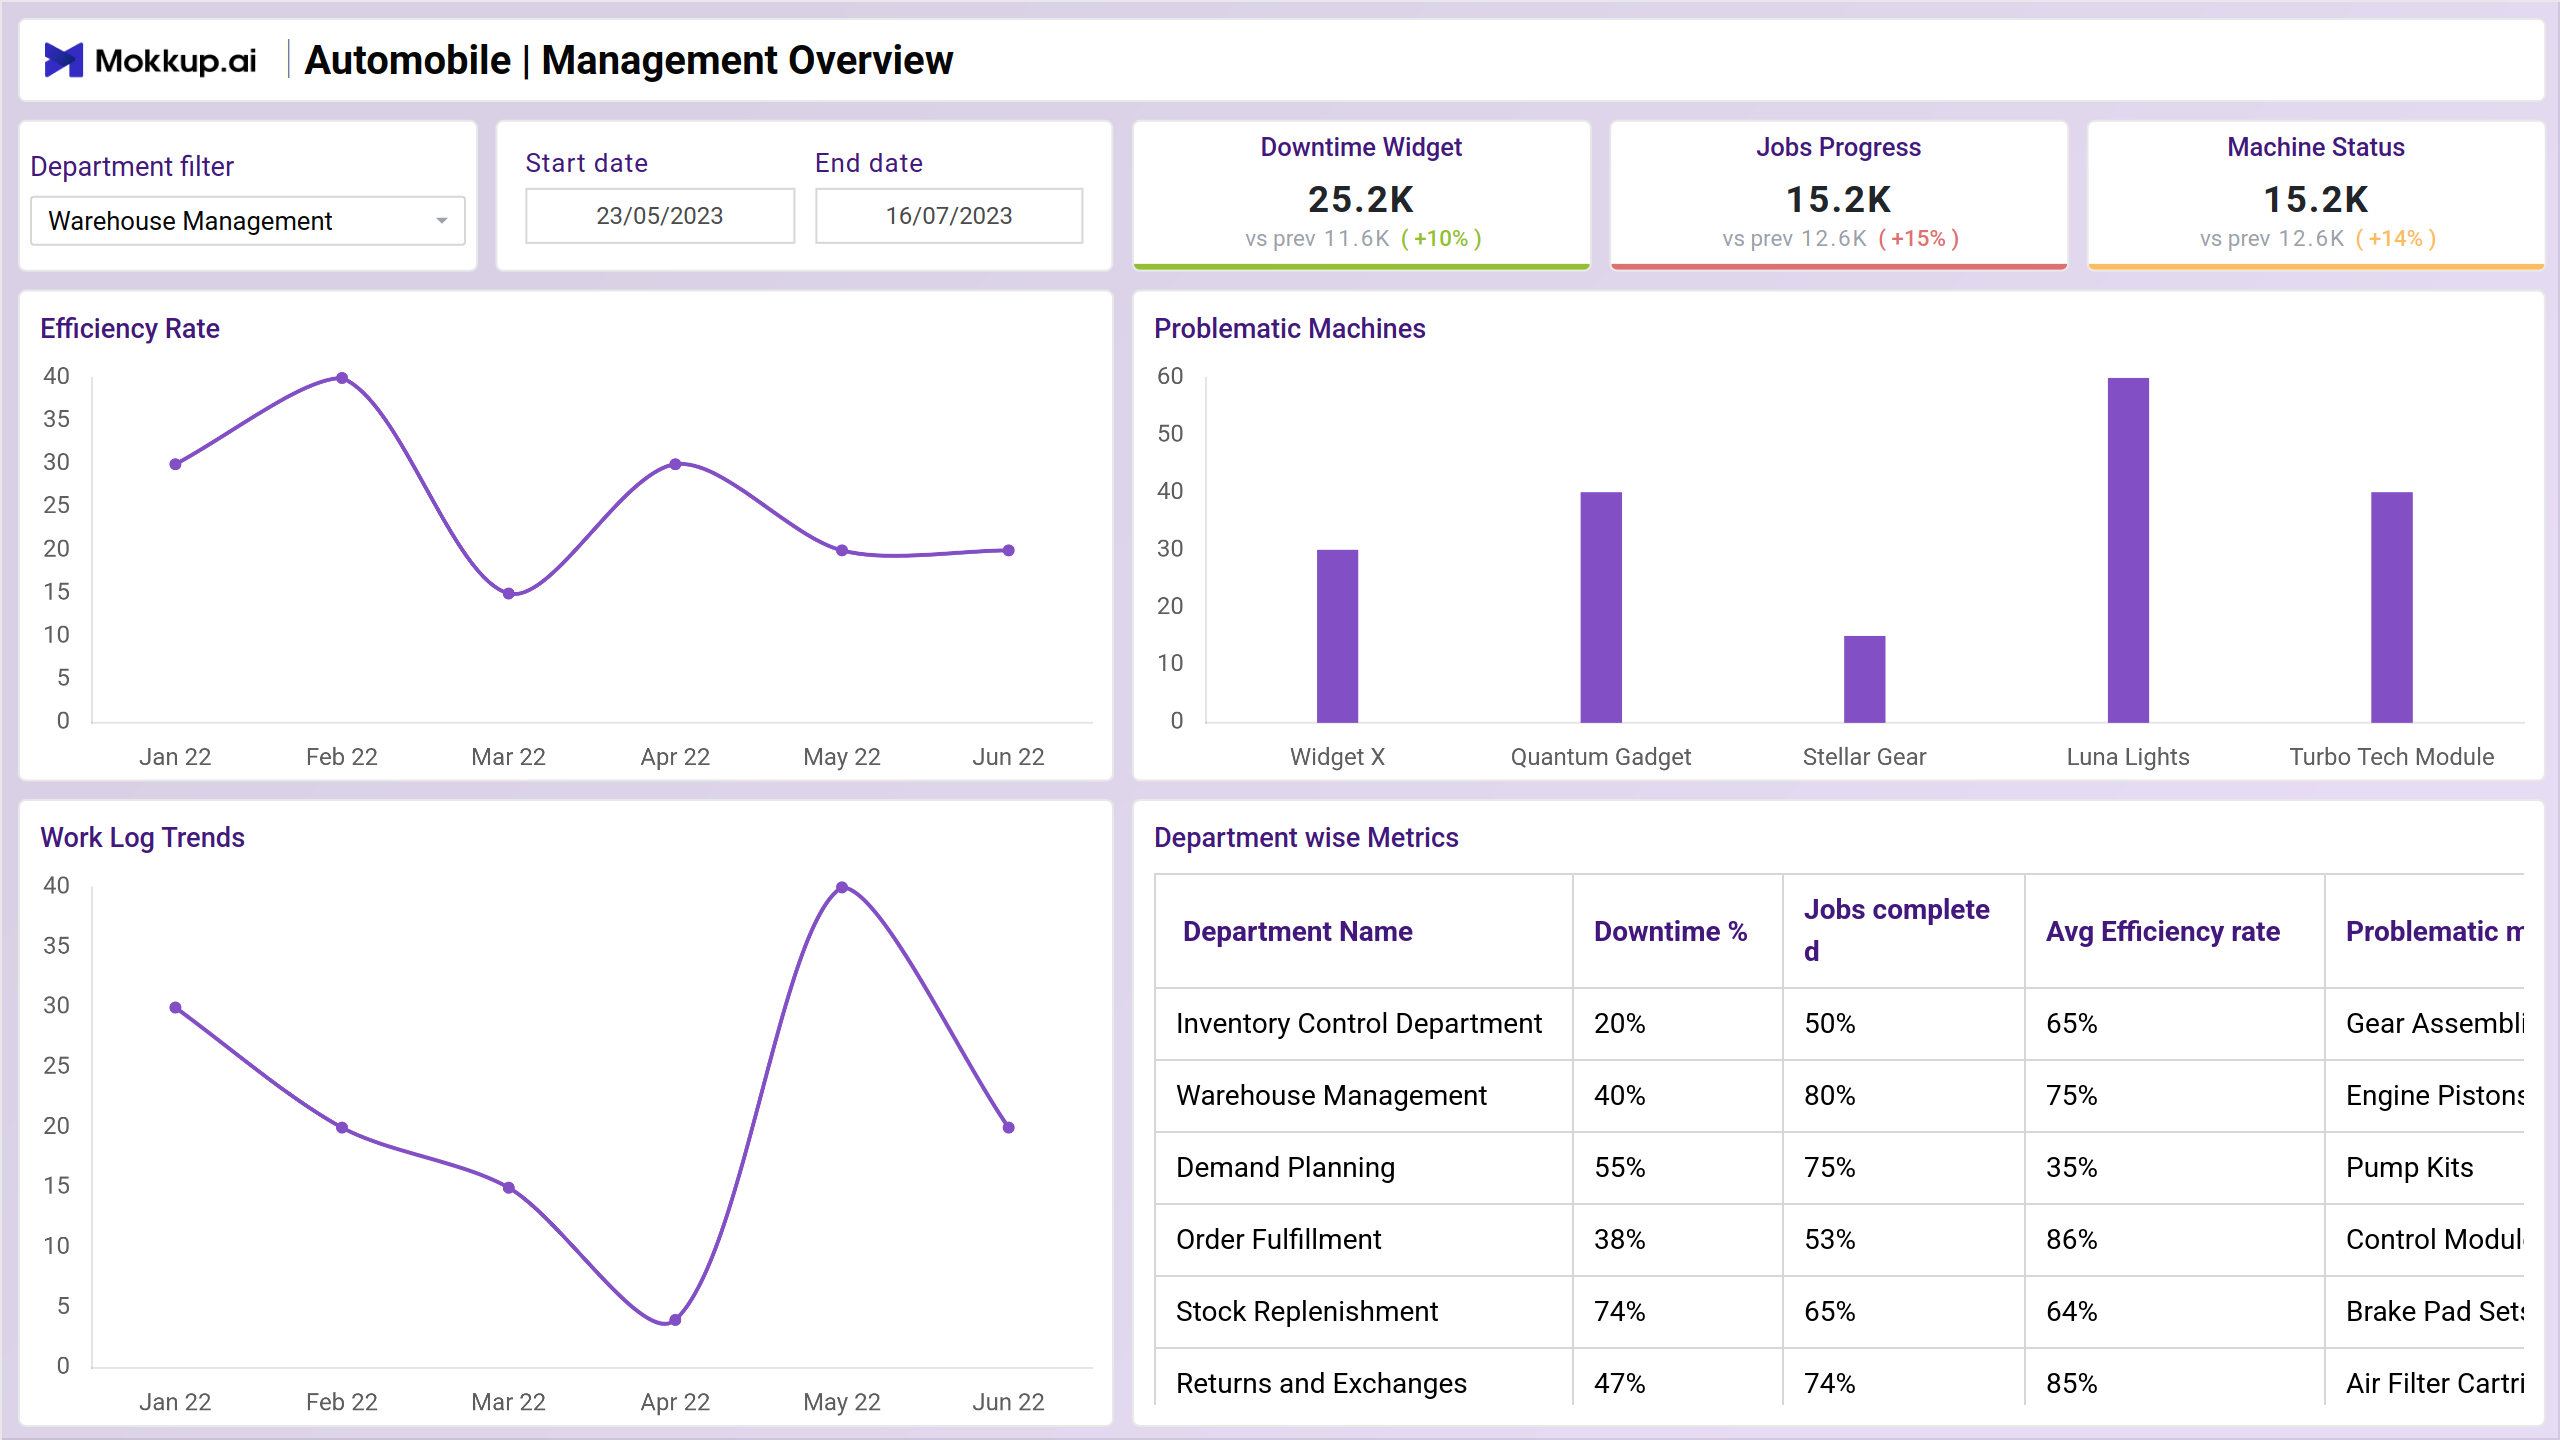
Screen 2: Executive Dashboard
Offers insights into efficiency rates, worklog trends, identifies top malfunctioning machines, and evaluates departmental performance through metrics like downtime percentage, average efficiency rate, and more.
Key Terms to consider:
- Department filter: Allows users to sort and view data based on specific departments, facilitating targeted analysis and decision-making.
- Downtime widget: Provides a visual representation of downtime periods, aiding in the identification of inefficiencies and opportunities for improvement.
- Jobs progress: Tracks the progress of ongoing jobs or tasks, enabling real-time monitoring and management.
- Machine status: Displays the operational status of machines or equipment, informing maintenance schedules and production planning.
- Top problematic machines: Identifies machines with recurring issues or maintenance needs, enabling proactive maintenance and minimizing disruptions.
- Efficiency rate: Quantifies the efficiency of operations or processes, providing insights into performance and productivity.
- Work log trends: Analyzes trends in work logs or activity records over time, guiding resource allocation and process optimization.
- Department-wise metrics: Provides department-specific metrics such as downtime percentage, completed jobs, average efficiency rate, and problematic machines, facilitating performance evaluation and departmental optimization.
Dashboard Template Insights
- The managerial dashboard provides comprehensive oversight for chief managers of engineering departments, covering inventory, production, and machinery management.
- Screen 1 concentrates on Spare Parts Inventory Management, offering insights into inventory consumption, usage trends, and identification of products in short supply.
- Screen 2, known as the Executive Dashboard, delivers crucial insights on efficiency rates, worklog trends, and departmental performance metrics.
- Key features like department filter and machine status are incorporated in these templates to facilitate targeted analysis and decision-making.
- These tools empower managers to optimize resources and enhance departmental performance through informed actions.
Conclusion
The managerial dashboard is a crucial wireframe for engineering chief managers, offering insights into inventory, machinery, and worklogs. It provides key metrics like inventory usage, machine performance, and departmental efficiency, helping in informed decision-making and proactive maintenance strategies.