The Attrition Report | Education dashboard template provides an in-depth overview of student retention and dropout metrics, allowing educational institutions to spot patterns and address issues that impact student persistence. By tracking enrolment, dropout rates, and critical demographic data, stakeholders can better understand the factors contributing to student attrition and develop retention strategies. Furthermore, it enables institutions to assess the effectiveness of programs that aim to lower attrition and create a more supportive learning environment.
Key Terms to Know
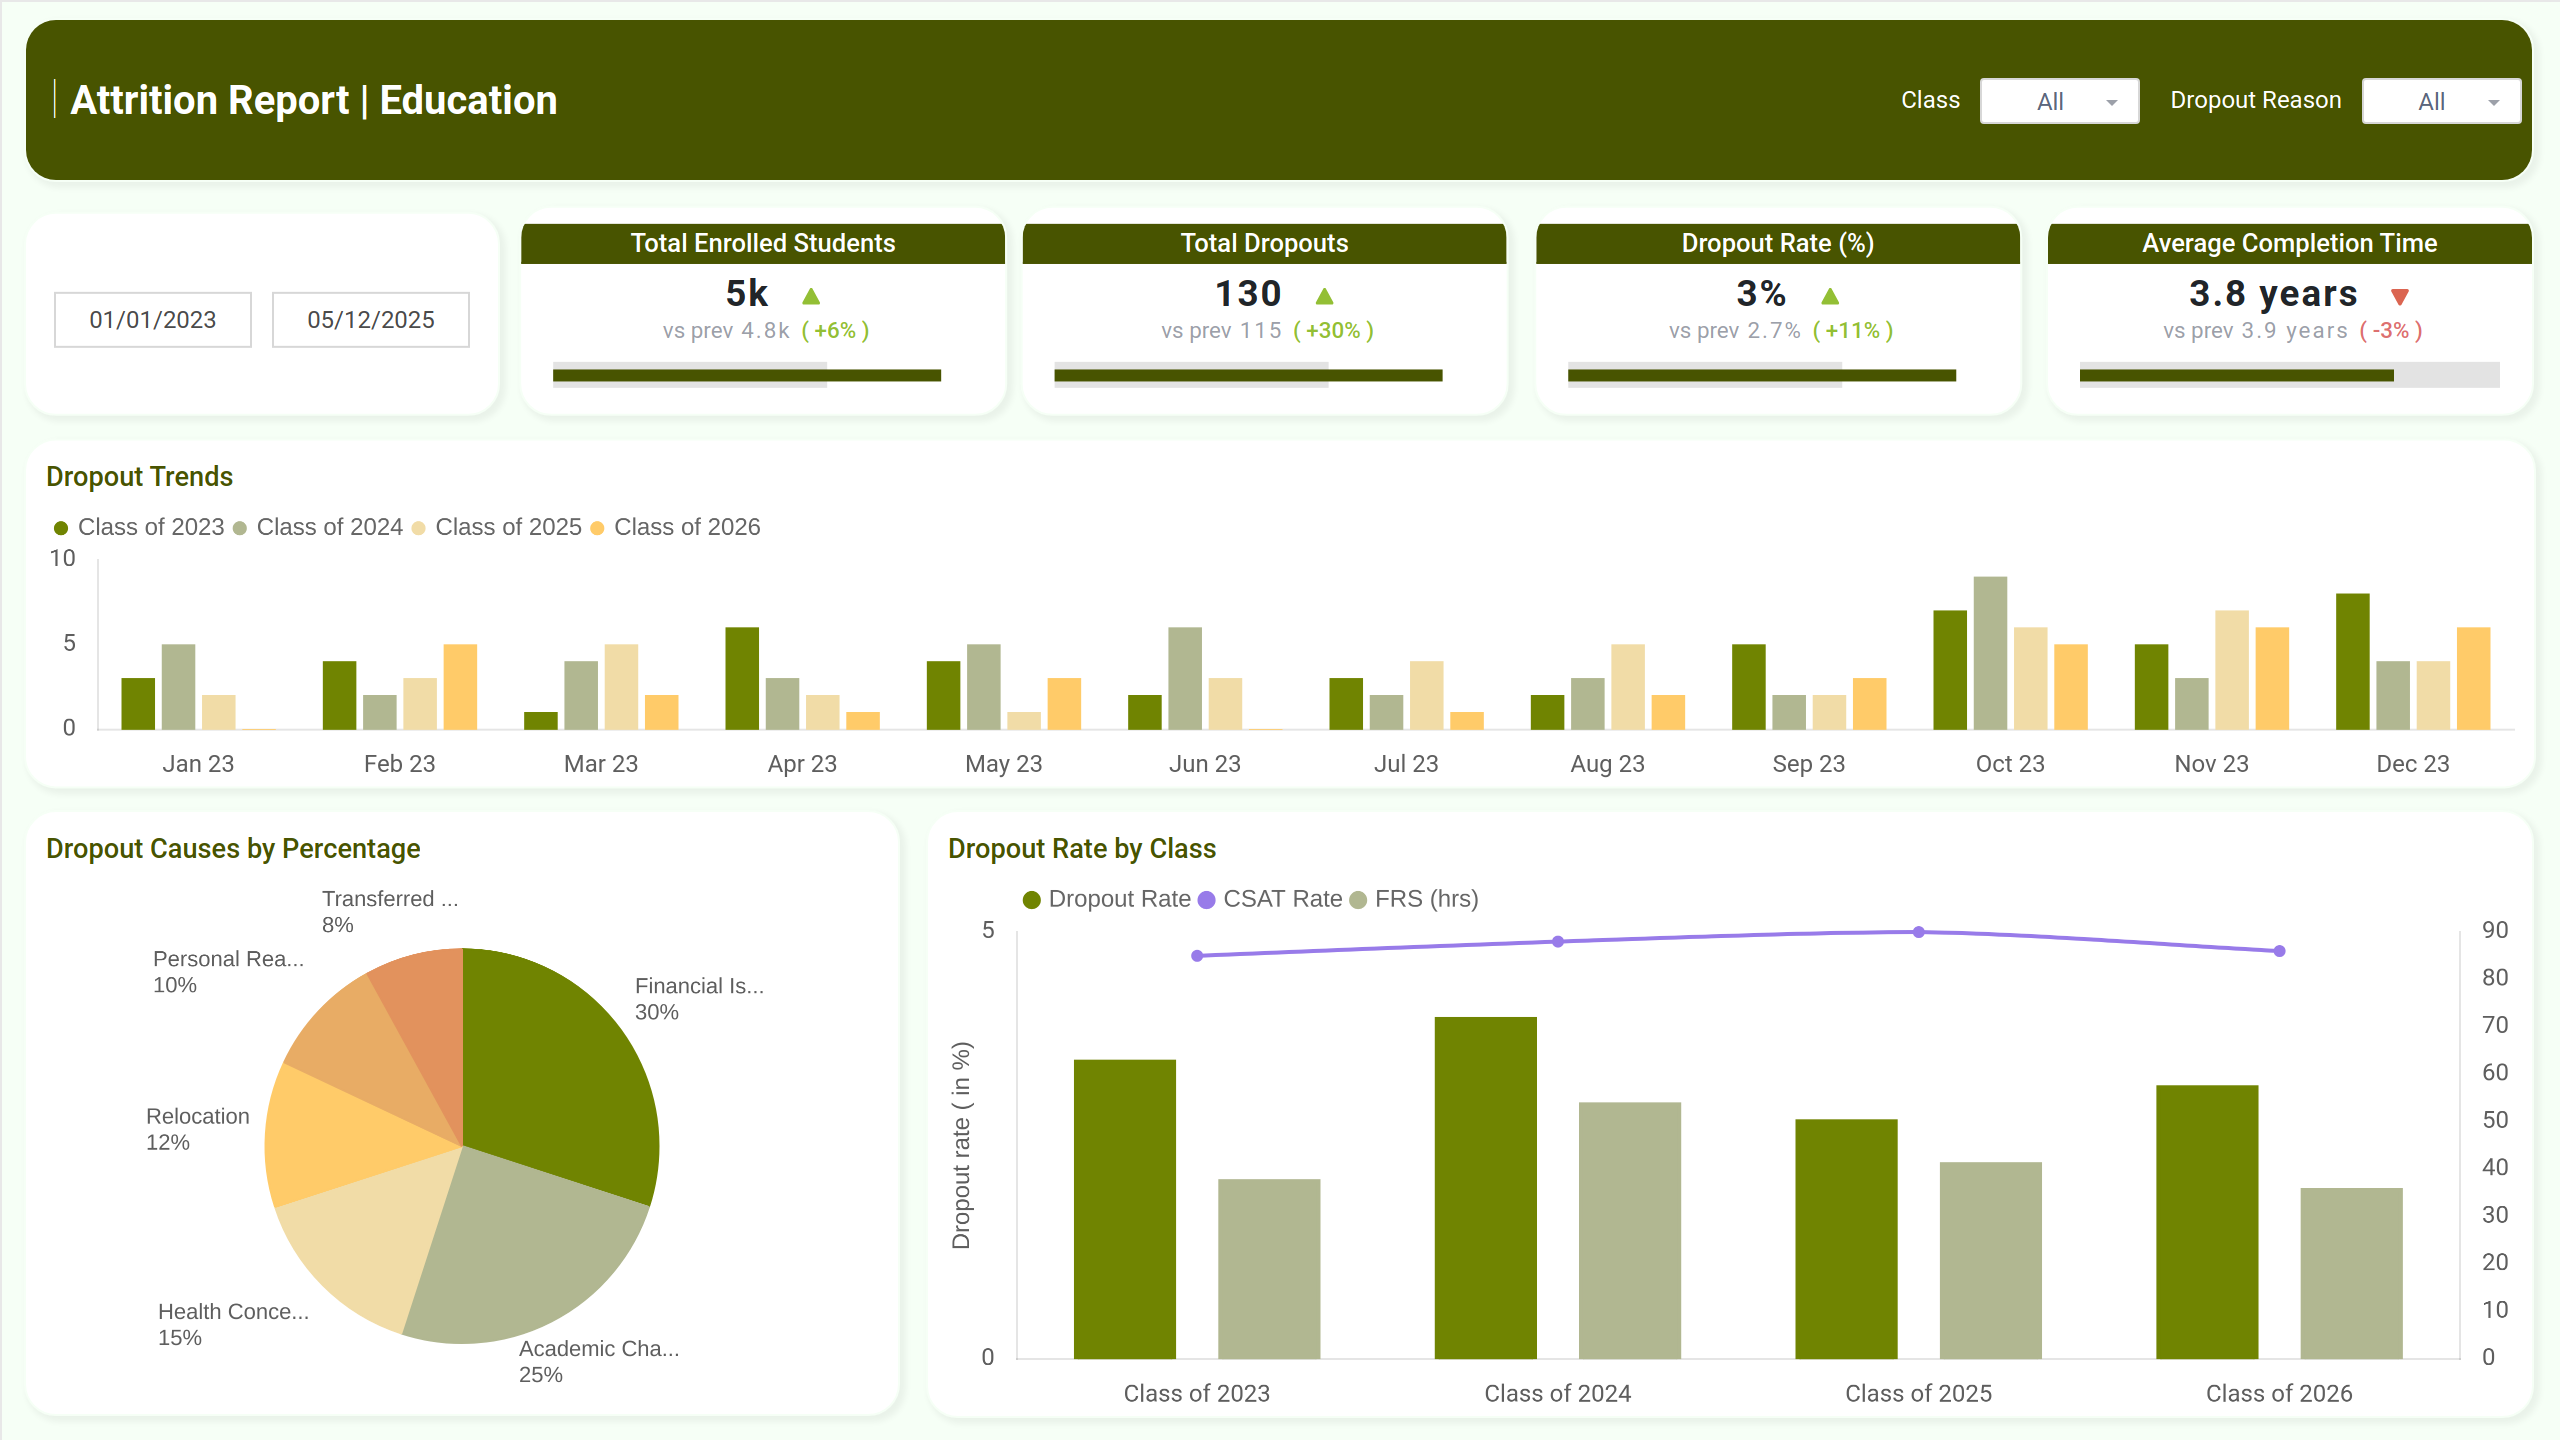
- Total Enrolled Students: The number of students currently enrolled in the educational program.
- Total Dropouts: The number of students who dropped out of the program.
- Dropout Rate (%): The proportion of students who dropped out compared to the total number of enrolled students.
- Average Completion Time: The average time it takes students to complete the program.
- Dropout Trends: A multi-column visual displaying dropout trends for a number of years.
- Dropout Demographics: A pie chart showing the causes of dropout, including transfer, personal reasons, relocation, financial issues, and health concerns.
- Dropout Rate by Class: A multi-column chart showing dropout rates for various classes, as well as the CSAT (Customer Satisfaction) rate and FRS (Faculty Response Score) over time.
Detailed Analysis
The second screen of the Attrition Report | Education dashboard wireframe includes specific details about student dropouts, allowing institutions to analyze reasons, trends, and correlations. It helps identify patterns associated with student performance and regional dropout rates, allowing for more effective retention methods and solutions.
Key Terms to Know
- Dropout Data Table: This shows detailed student information, such as dropout rates, reasons, and enrolment data.
- Dropout Reason Analysis: Displays the distribution of dropout causes on a treemap.
- Funnel Analysis of Dropout Process: Tracks the stages in the student engagement process leading to dropout.
- Dropout Correlation Map: Highlights regional patterns and factors contributing to student dropouts.
- Average Grades vs Dropouts: Scatter plot showing the relationship between academic performance and dropout rates.
Dashboard Template Insights
The dashboard wireframe offers detailed insights into student dropout trends, demographics, and academic performance, helping institutions improve retention strategies.
- Tracks dropout rates, reasons, and trends over time.
- Examines the relationship between dropout rates and variables like grades and demographics.
- Identifies at-risk students for targeted intervention strategies.
- Shows dropout reasons and processes using different visualizations.
- Offers data-driven insights for increasing student retention.
Conclusion
The Attrition Report | Education dashboard template evaluates dropout rates and important factors contributing to attrition. It assists educational institutions in identifying at-risk students and executing targeted interventions. The actionable insights can help improve student retention tactics, resulting in better student and institution outcomes.