The App Dashboard is a central command hub designed to optimize user experience and app performance. Through interactive charts and graphs, stakeholders can analyze trends, identify potential issues, and make informed decisions to enhance app functionality.
Screen 1:
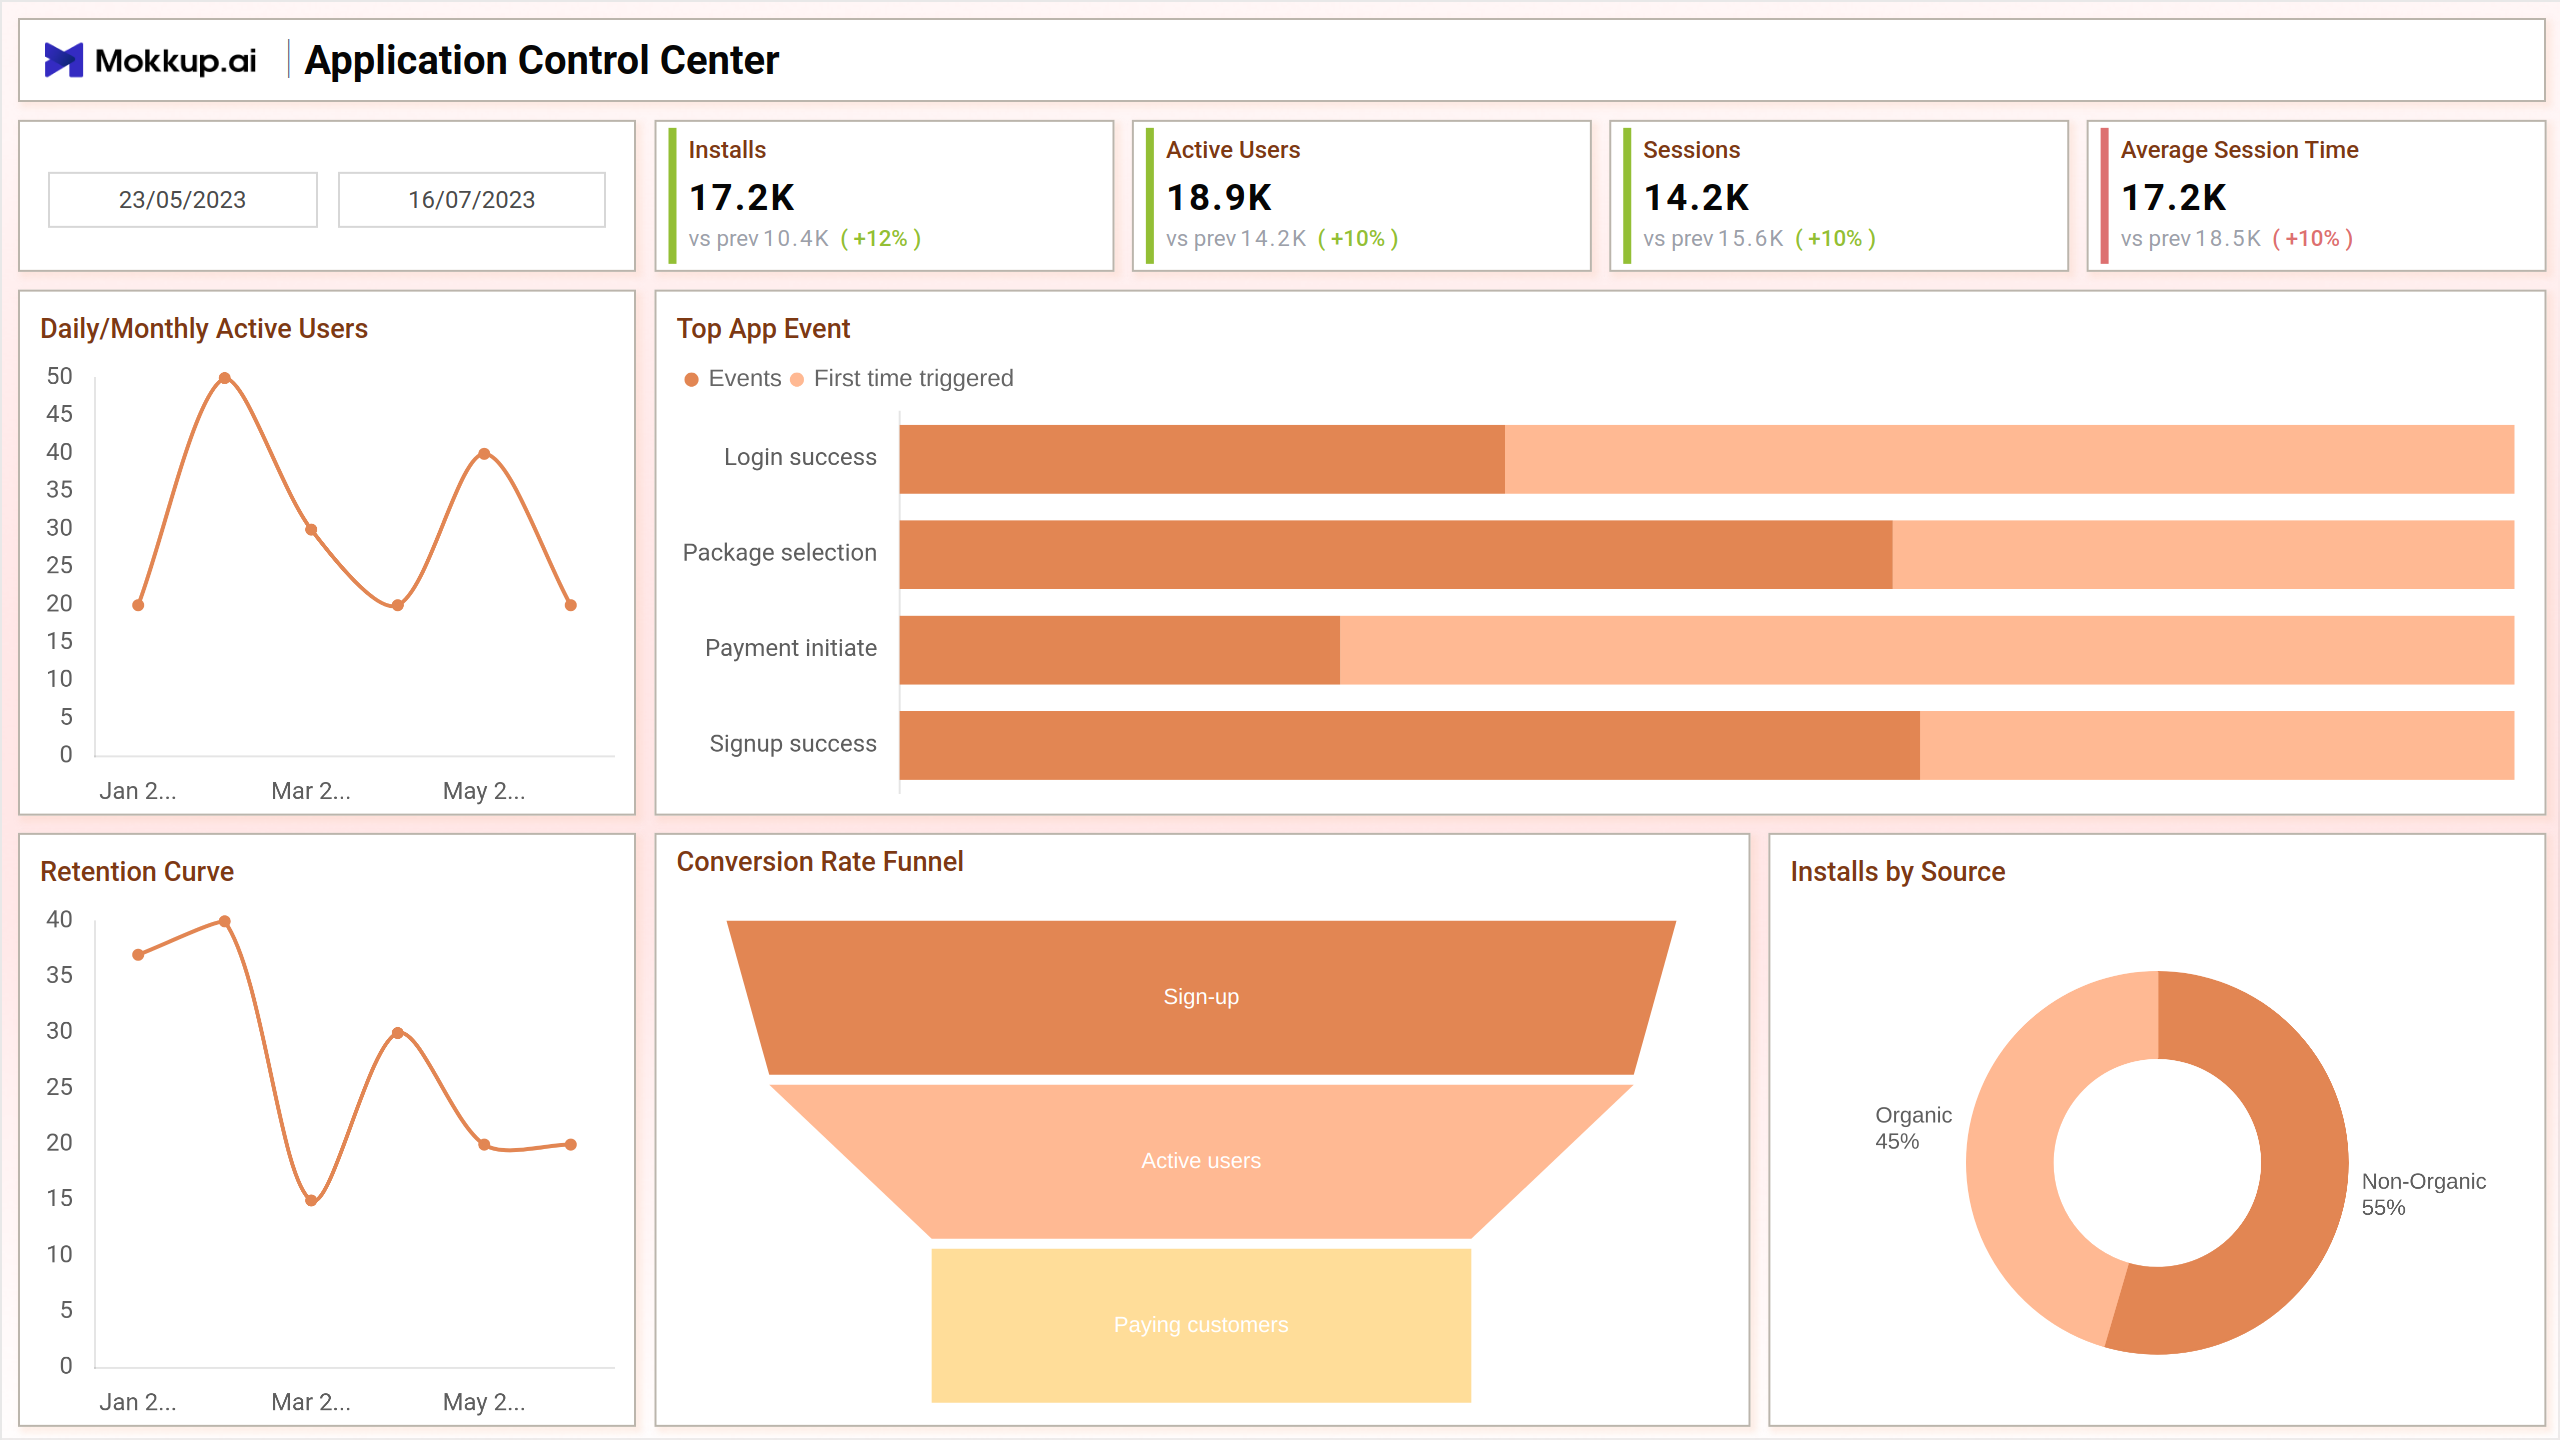
This screen provides valuable insights into user behavior, allowing for target improvements and feature enhancements. This centralized platform fosters agile development practices and strategic decision-making, making it an essential resource for app optimization and success.
Key Terms to consider:
- Top App Event - Identify the most significant app event with Top App Event analysis.
- Installs - Track the total number of installations with the Installs metric.
- Sessions - Monitor user engagement by the number of sessions.
- Daily/Monthly Active Users - Evaluate the overall activity with Daily/Monthly Active Users data.
- Retention Curve - Understand customer retention patterns with the Retention Curve analysis.
- Conversion Rate Funnel - Analyze user journey efficiency through the Conversion Rate Funnel.
- Installs by Source - Determine the origin of installations with the Installs by Source metric.
Screen 2:
Explore the allocation of resources effectively by analyzing Marketing Spends by Channel and gain a comprehensive understanding of diverse income streams with the Revenue Sources feature. Monitor user profitability trends over time with the ARPU Trend while tracking the overall financial performance through the Total Revenue Trend. These analytics collectively provide a nuanced perspective to refine your business strategies and enhance overall performance.
Key Terms to consider:
- Marketing Spends by Channel - Allocate resources effectively by analyzing Marketing Spends by Channel.
- Revenue Sources - Identify diverse revenue streams with the Revenue Sources analysis.
- ARPU Trend - Monitor the Average Revenue Per User (ARPU) Trend for insights into user profitability.
- Total Revenue Trend - Track the overall financial performance through the Total Revenue Trend.
- ARPU - Evaluate user profitability with the Average Revenue Per User (ARPU) metric.
- Conversion Rate - Assess user journey efficiency through the Conversion Rate analysis.
- Total Marketing Cost - Gauge the overall marketing expenditure with the Total Marketing Cost.
- Cost per Install - Measure cost-effectiveness with the Cost per Install metric for marketing campaigns.
Screen 3:
Gain nuanced insights into user engagement and demographics with metrics like "Average Session Time by Region" and "Gender Ratio" while optimizing resource allocation through "Marketing Spends by Channel" and refining strategies with "Average Session Time by Age and Gender."
Key Terms to consider:
- Average session Time by Region - Analyze user engagement patterns with Average Session Time by Region.
- Gender Ratio - Understand the demographic makeup with the Gender Ratio metric.
- Marketing Spends by Channel - Optimize resource allocation by assessing Marketing Spends by Channel.
- Average Session Time by Age and Gender - Tailor marketing strategies by evaluating Average Session Time by Age and Gender.
Dashboard Template Insights
The App Dashboard is a pivotal template, enabling agile development and strategic decision-making to optimize user experience and drive app success. Screens 1, 2, and 3 offer nuanced insights into users’ behavior, resource allocation, and demographics, empowering stakeholders to refine strategies and enhance overall app performance.
Conclusion
By offering a consolidated view of key performance indicators and trends, the App Dashboard empowers developers, marketers, and product managers to optimize the app experience, maximize user engagement, and drive app success in a competitive mobile app landscape.