
What is an HR Recruitment Dashboard?
An HR Recruitment Dashboard Template is a consolidated analytics solution designed to help hiring teams monitor every stage of the hiring lifecycle. It consolidates recruitment KPIs, candidate pipeline metrics, and hiring performance data into a single interactive view. This dashboard serves as a central applicant tracking system, enabling recruiters to easily evaluate sourcing efficiency, monitor vacancies, track shortlisted candidates, assess hiring funnel drop-offs, and compare recruiter or job role performance.
This type of dashboard provides structured recruitment data visualization that supports talent teams in managing high-volume applications, analyzing hiring bottlenecks, and improving hiring decisions. The template also serves as an HR recruitment reporting and analytics tool, providing talent acquisition teams with actionable insights to optimize sourcing channels, refine screening criteria, and accelerate offer rollouts.
How to Create an HR Recruitment Dashboard
You don’t need to build your report from scratch—just start with a ready-to-use dashboard template from Mokkup. Add in your data and export it however you like. Here’s how to do it:
1. Create or Log in to Your Mokkup Account
Start by signing up on Mokkup.ai using your email. If you already have an account, just log in, and you’ll be good to go.
2. Choose and Customize Your Dashboard Template
Find the HR Recruitment Dashboard template in the Templates section. Use the drag-and-drop editor to adjust KPIs, edit filters, or add elements based on your data.
3. Export to Your BI Tool
Once your dashboard wireframe is ready, use the BI Tool Export feature to send it directly to Power BI or Tableau for further analysis and enhancements. You can also download the dashboard as a PDF, PNG, or JPEG, embed it on a platform, or invite your team to collaborate.
Note: This is a Pro template. You’ll need a Pro subscription on Mokkup to use and customize this dashboard wireframe. Upgrade anytime to unlock full access.
HR Recruitment Dashboard Example
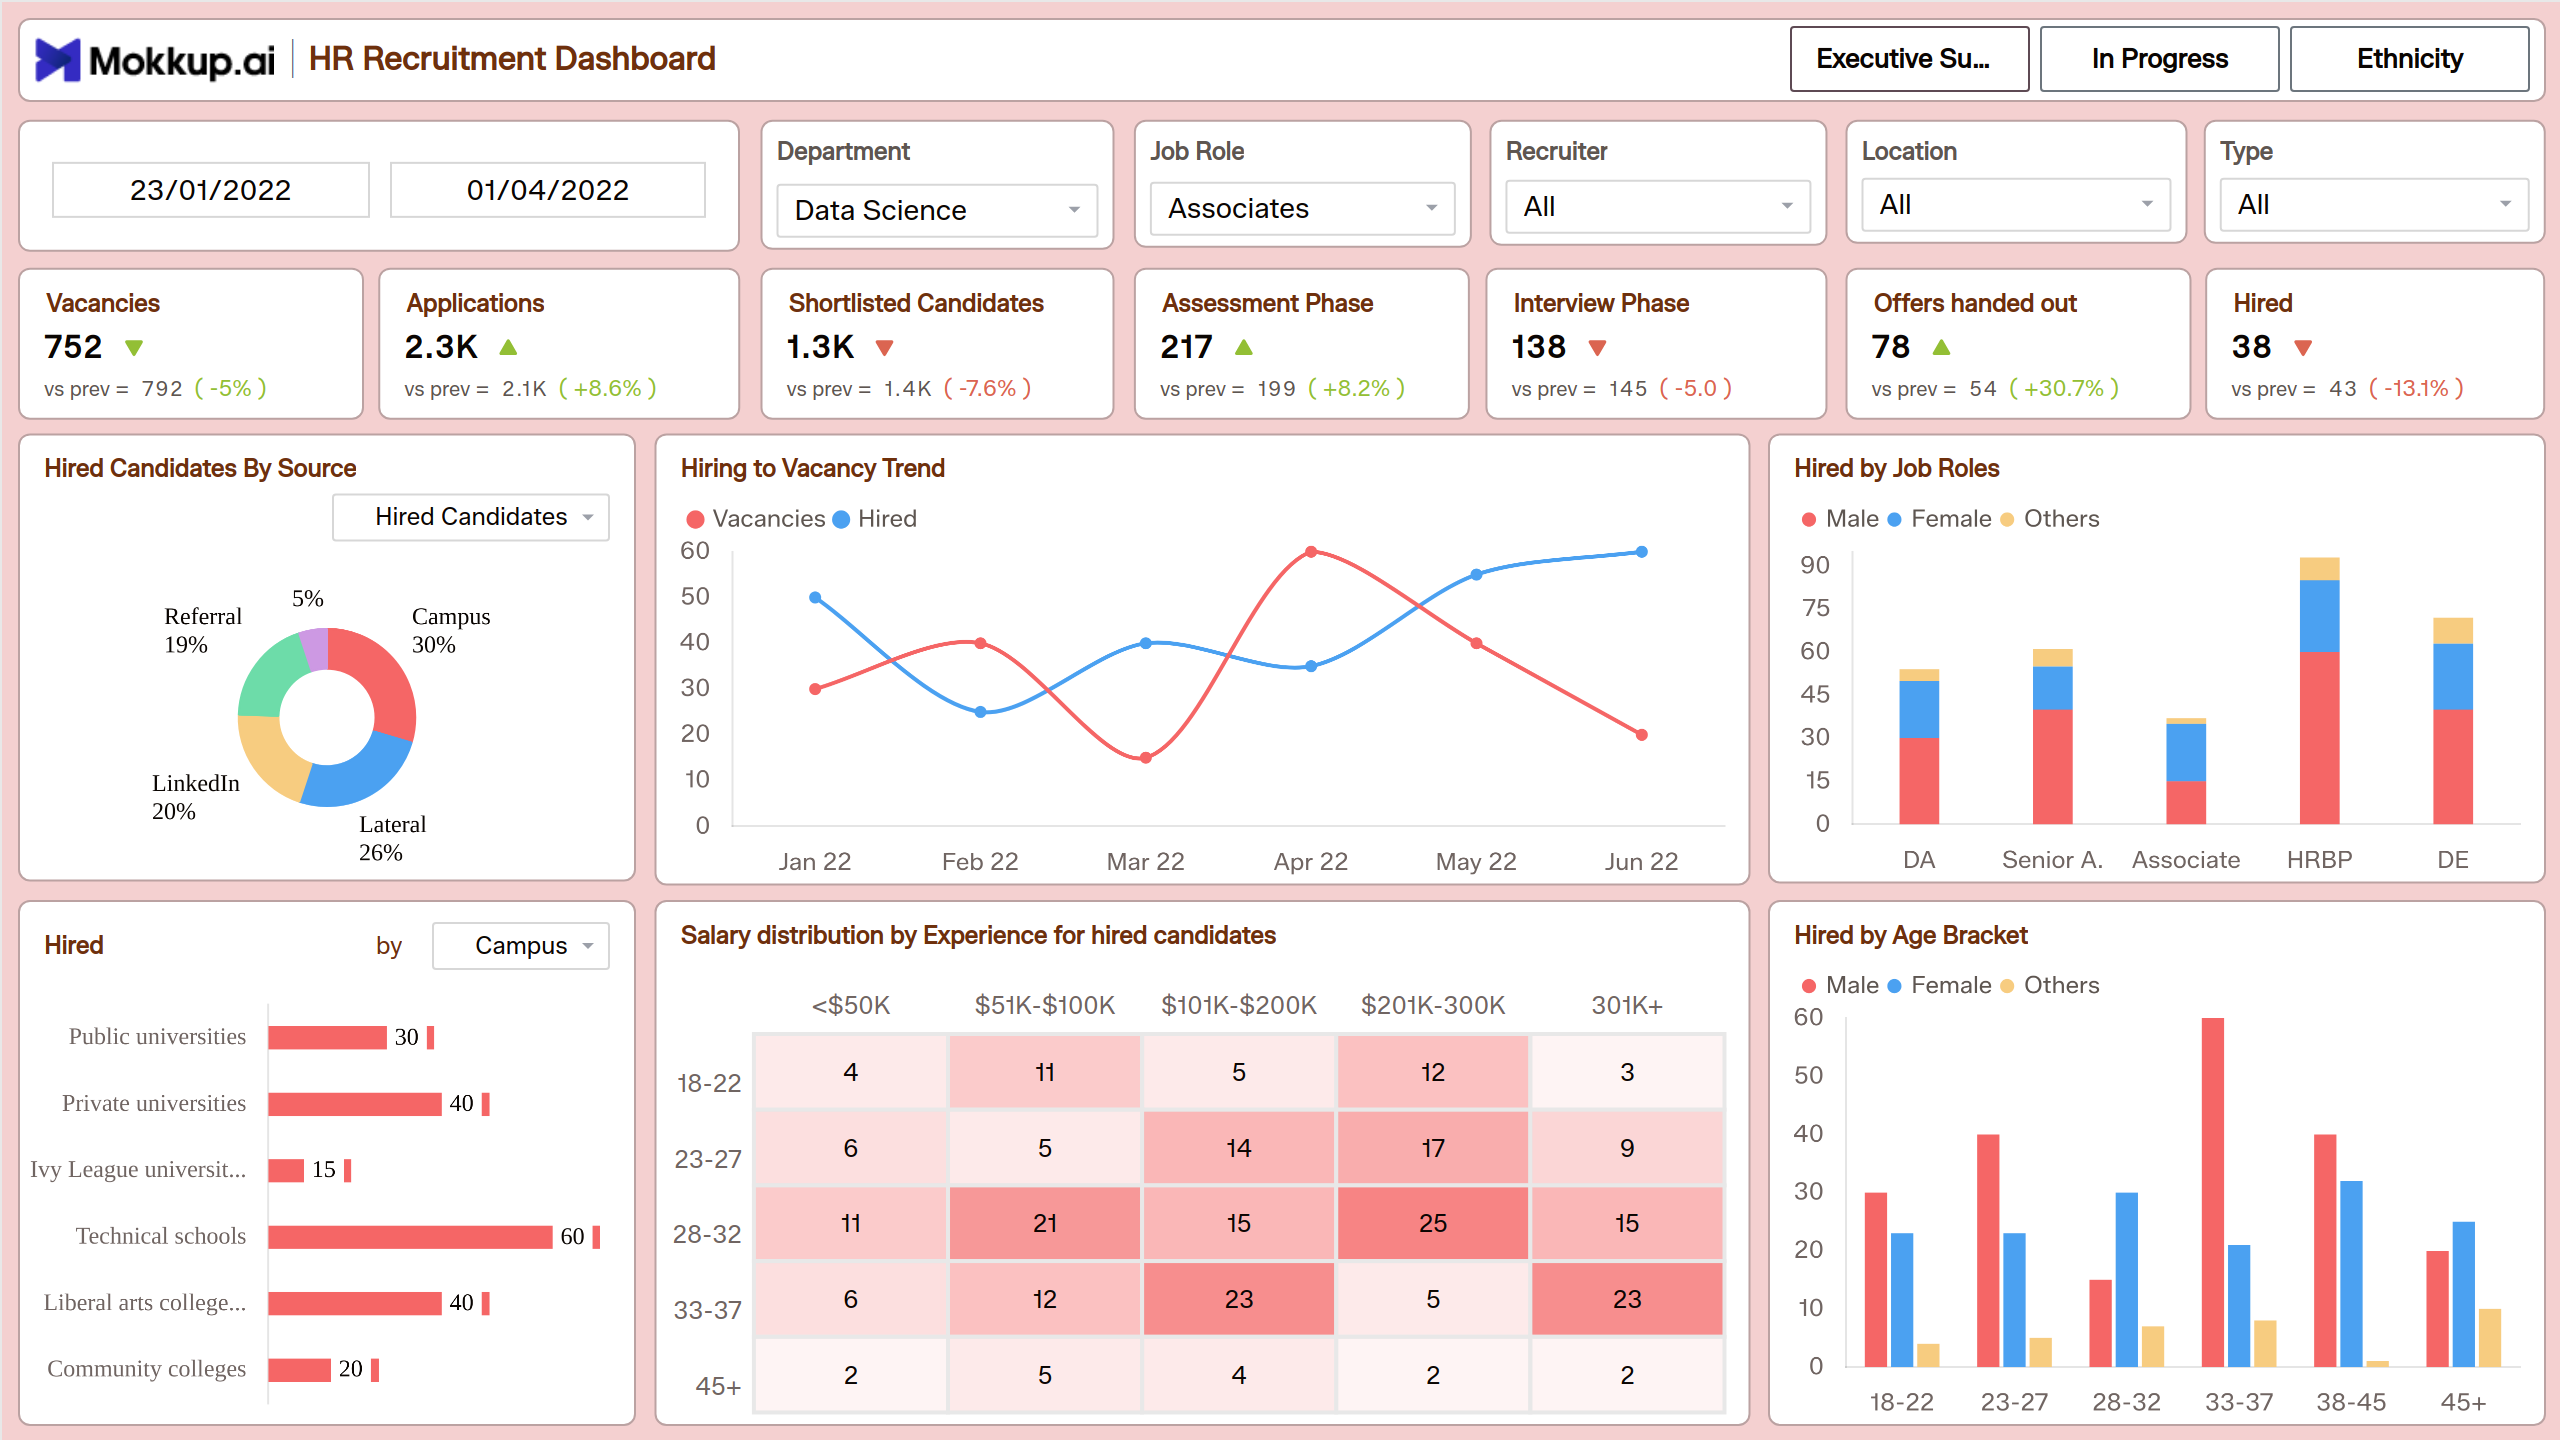
A typical HR Hiring Performance Dashboard for Recruiters includes multiple KPI blocks, sourcing analytics, funnel tracking visuals, and demographic insights. Based on the sample dashboard, recruiters can view live statistics for vacancies, applications, shortlisted candidates, assessment stages, interview stages, and offers extended. Charts such as doughnut charts, line graphs, stacked bar charts, and heatmaps are used to display sourcing contribution, vacancy-to-hiring trends, job role-wise hiring, and salary distribution across experience levels.
The dashboard also visualizes hired candidates by age bracket, hiring by institution type, and salary distribution heatmaps, providing a more profound understanding of workforce demographics. With these visual insights, hiring managers can evaluate funnel progression over time, understand sourcing ROI, and align hiring efforts with organizational needs.
How to Analyze Data in HR Recruitment Dashboards
This HR recruitment dashboard template for hiring teams analyzes data in the following ways:
- Review the number of vacancies to understand hiring load across departments and roles.
- Track applications and shortlisted candidates to measure sourcing efficiency and screening effectiveness.
- Analyze assessment and interview phases to detect bottlenecks and stage-wise drop-offs.
- Compare offers handed out vs. candidates hired to measure final-stage conversion rates.
- Monitor hired candidates by source to identify high-performing channels such as campus hiring, referrals, LinkedIn, or lateral talent pools.
- Use the hiring-to-vacancy trend chart to compare hiring velocity with the demand for open roles.
- Evaluate job role–wise hiring charts to assess team-level or recruiter-level performance.
- Use age and experience distribution visuals to understand workforce diversity and compensation patterns.
Benefits of HR Recruitment Dashboard
Here are the benefits of using the HR recruitment reporting and analytics template:
- Provides a unified view of hiring metrics for faster decision-making.
- Improves pipeline visibility across sourcing, screening, assessment, and offer stages.
- Enhances recruiter productivity with automated recruitment reporting and analytics.
- Helps hiring managers identify delays and optimize each stage of the recruitment funnel.
- Supports data-backed resource planning and workload distribution across hiring teams.
- Improves sourcing ROI by showing which channels deliver high-quality candidates.
- Enables leadership teams to track hiring performance across job roles and locations.
KPIs to Track in HR Recruitment Dashboard
From this applicant tracking dashboard, the following KPIs can be tracked:
- Number of Vacancies: Indicates the total number of open positions across roles and departments, highlighting current hiring demand.
- Applications Received: Measures the volume of incoming applicants to assess the strength of the candidate pipeline.
- Shortlisted Candidates: Indicates how many candidates passed initial screening, reflecting overall application quality.
- Assessment Phase Count: Tracks candidates who moved to assessments, showing engagement and skill-fit progression.
- Interview Phase Count: Measures the number of candidates reaching interviews, helping identify bottlenecks or delays in the recruitment funnel.
- Offers Handed Out: Shows the number of offer letters issued, indicating final-stage hiring decisions.
- Candidates Hired: Tracks successfully onboarded candidates, representing overall hiring success.
- Hired Candidates by Source: Highlights which sourcing channels deliver successful hires for better budget allocation.
- Hiring to Vacancy Trend: Compares hiring progress against open roles to measure hiring speed and efficiency.
- Hired by Job Roles: Shows hiring distribution across job roles to evaluate role-specific staffing performance.
- Hired by Age Bracket: Breaks down hires by age groups to understand demographic patterns in the workforce.
- Salary Distribution by Experience: Displays compensation levels across various experience groups to evaluate pay alignment.
Frequently Asked Questions
1. How to create an effective HR recruitment dashboard?
An effective HR recruitment dashboard is created by identifying the most important KPIs, using clear and interactive visualizations, and ensuring the dashboard aligns with the organization’s hiring objectives.
2. What KPIs should be tracked in recruitment dashboards?
Recruitment dashboards should track key KPIs such as time-to-hire, source effectiveness, offer acceptance rates, and diversity metrics segmented by age, gender, and ethnicity.
3. Best metrics for measuring hiring process efficiency?
The most useful metrics for measuring efficiency include cost-per-hire, candidate selection rate, filled roles versus vacancies, and the reasons for job offer declines.
4. How to visualize candidate pipeline data effectively?
Candidate pipeline data can be visualized effectively through funnel charts, progress distribution visuals, candidate summaries, and filters for department, role, or location.
5. What features are essential in recruitment analytics tools?
The most essential features include customizable filters, drill-down capabilities, diversity tracking, and simple export options for reporting.