
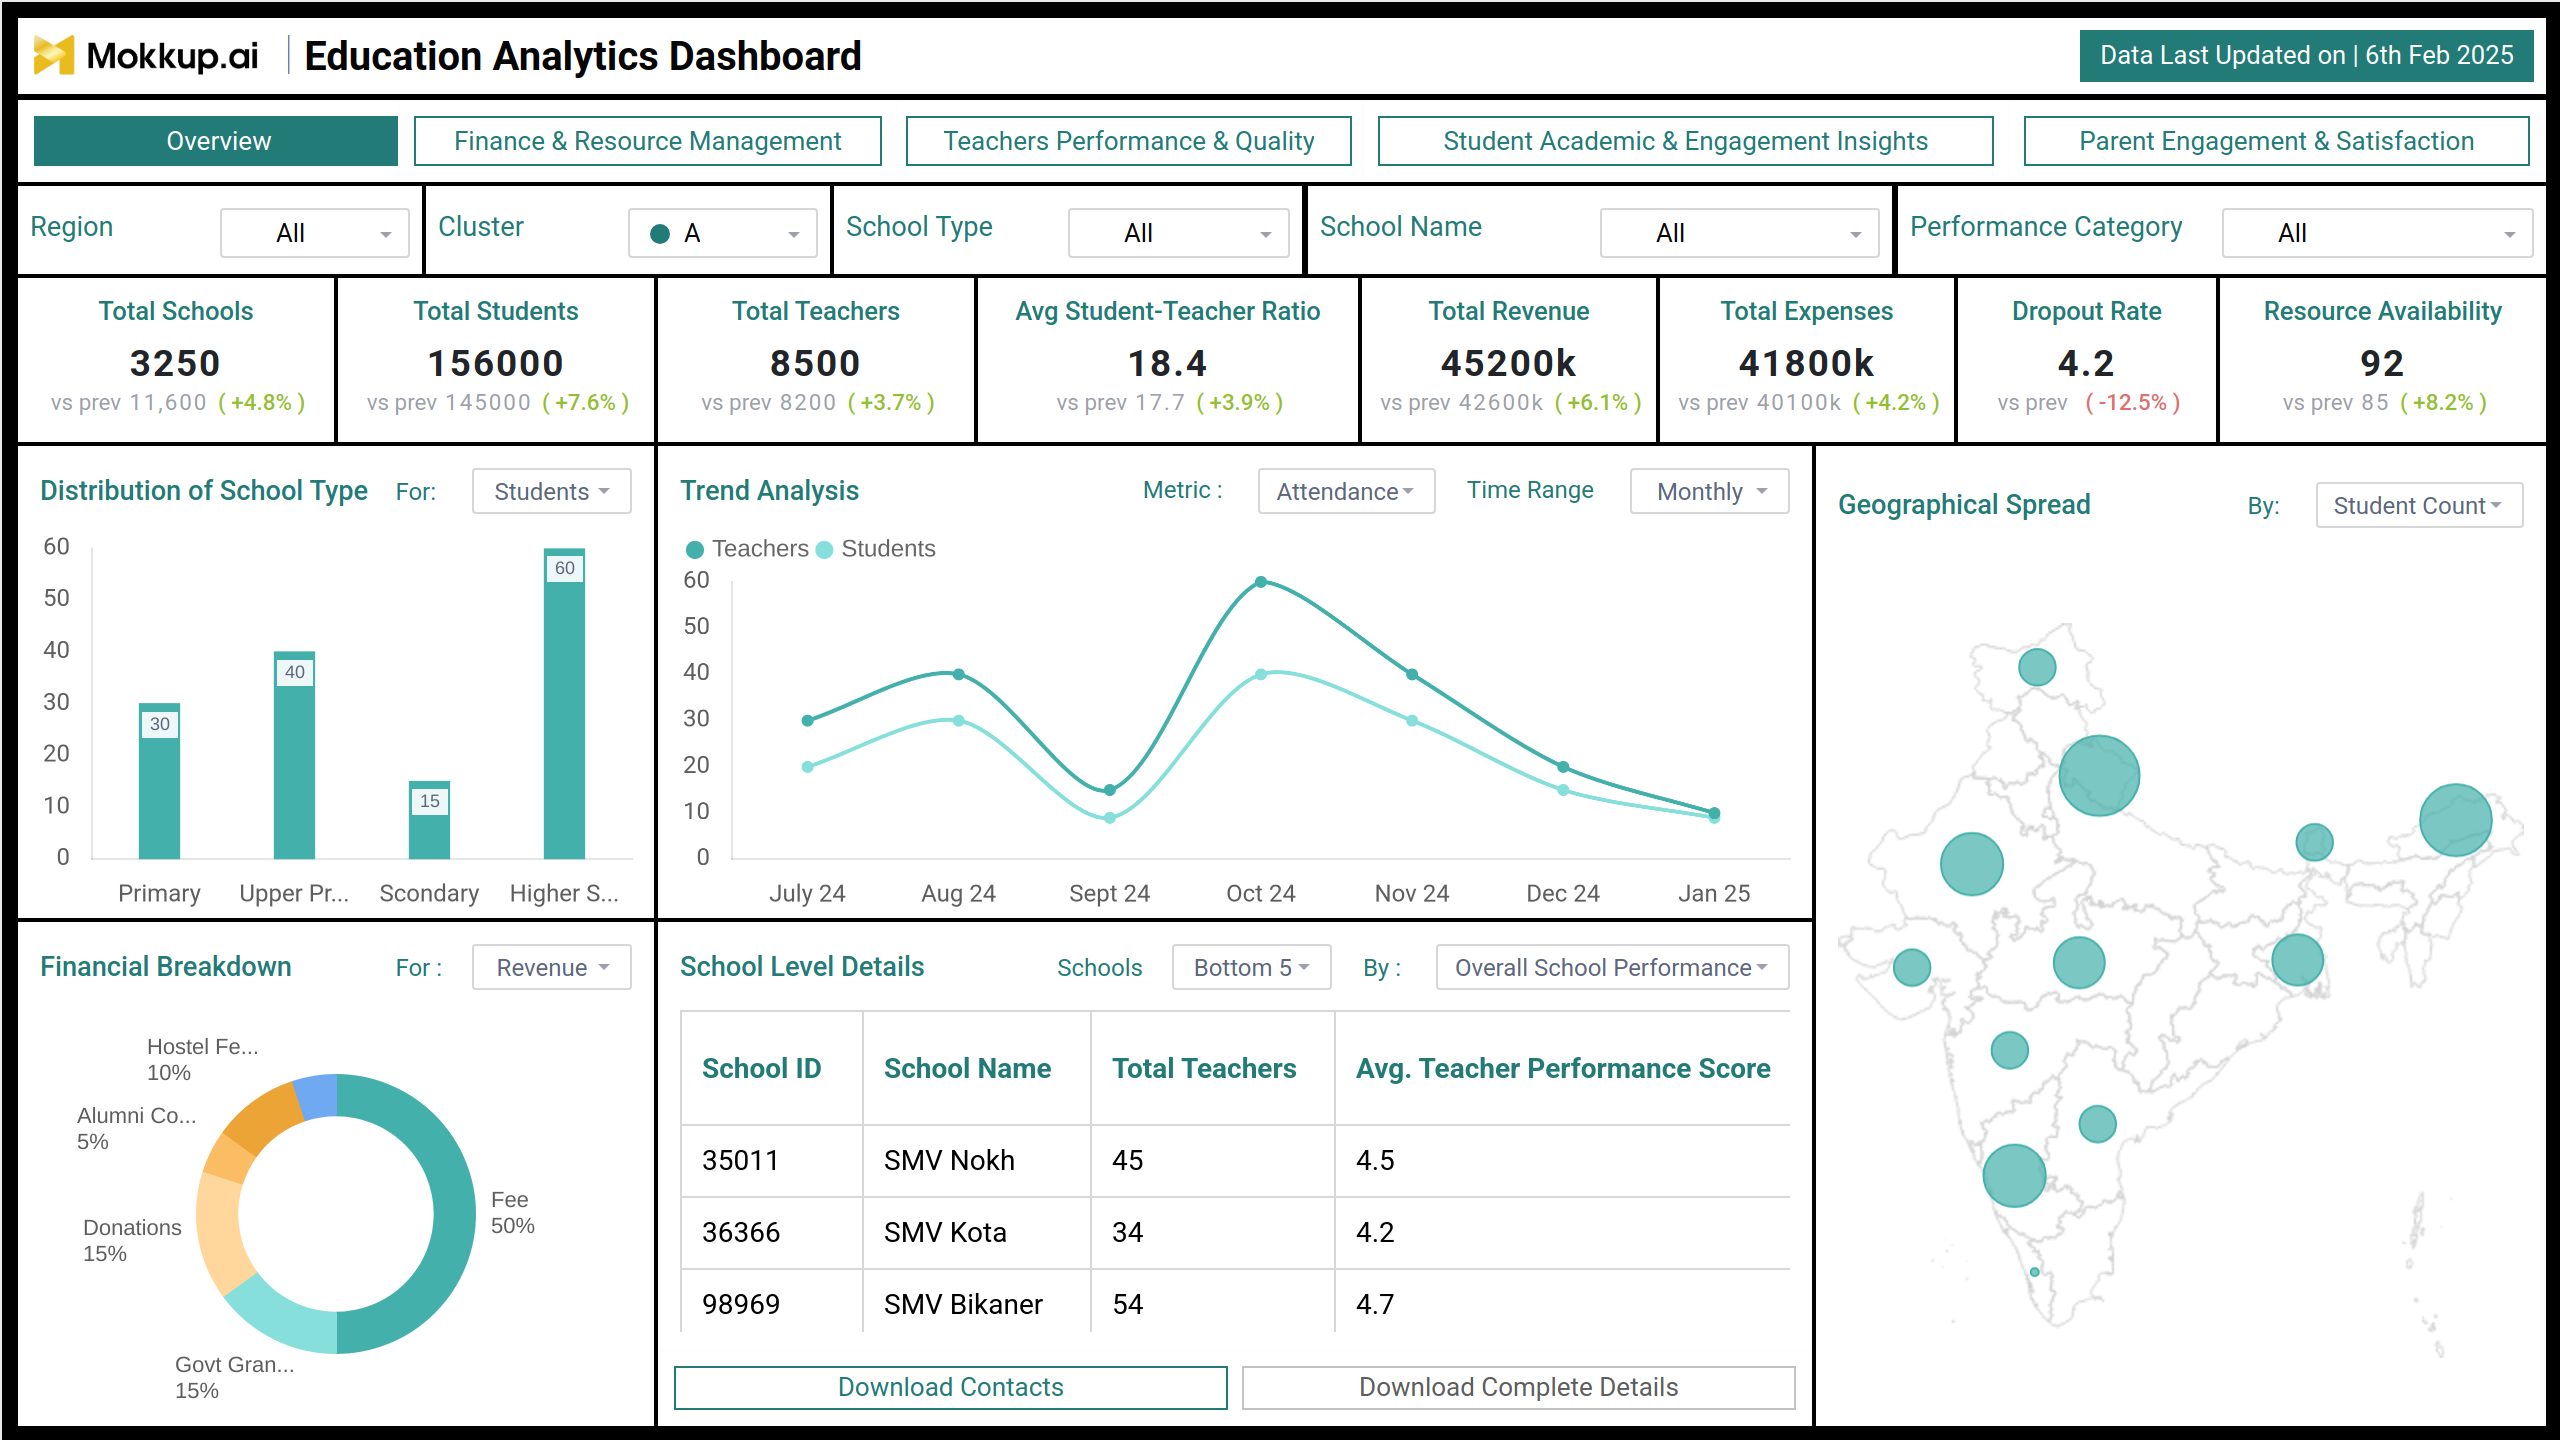
It is a data visualization tool meant to offer educators, administrators, and other stakeholders a complete view of critical educational data and performance measures. It collects data from a variety of sources within an educational institution, including employee information systems, learning management systems, assessment tools, etc.
Screen 1: Performance
Provides an overview of the performance tab and offers a breakdown of staff members by their educational qualifications and the distribution of courses within different categories.
Key Terms to consider:
- Dashboard last updated at: Indicates the timestamp of the dashboard's last update, ensuring users have access to the most recent data.
- Number of staffs education category wise: Provides a breakdown of staff members categorized by their educational backgrounds, aiding in targeted training initiatives.
- Courses distribution: Displays the distribution of courses offered, facilitating analysis of resource allocation and curriculum planning.
- Number of skill development courses: Quantifies the total number of courses focused on skill development, highlighting opportunities for professional growth.
- Number of participants: Counts the total number of individuals enrolled in courses or programs, reflecting engagement levels and program popularity.
- Performance meter: Measures and visualizes participant performance, providing insights into skill acquisition and course effectiveness.
Screen 2: Summary
The summary tab provides an overview of the employee details such as, educational history, performance score, and more.
Key Terms to consider:
- Dashboard last updated at: Indicates the timestamp of the dashboard's last update, ensuring users have access to the most recent data.
- Education summary: Provides a concise overview of employee educational data, facilitating analysis of workforce qualifications and skill levels. Specifies the components included in the education summary, offering detailed insights into employee education, performance, and training progress.
Dashboard Template Insights
The educational dashboard offers educators, administrators, and stakeholders a comprehensive view of critical educational data collected from various sources within educational institutions. Screen 1, the Performance tab, provides insights into staff qualifications, course distribution, and participant engagement, while Screen 2, the Summary tab, offers an overview of employee educational history and performance scores. With key metrics like the last updated timestamp and education summary, stakeholders can make informed decisions to enhance education and training initiatives.
Conclusion
An education dashboard is a tool that provides a comprehensive overview of various areas of an educational institution's performance and operations. This data-driven approach enables educational institutions to make informed decisions, improve the quality of education, and ensure effective resource management.