
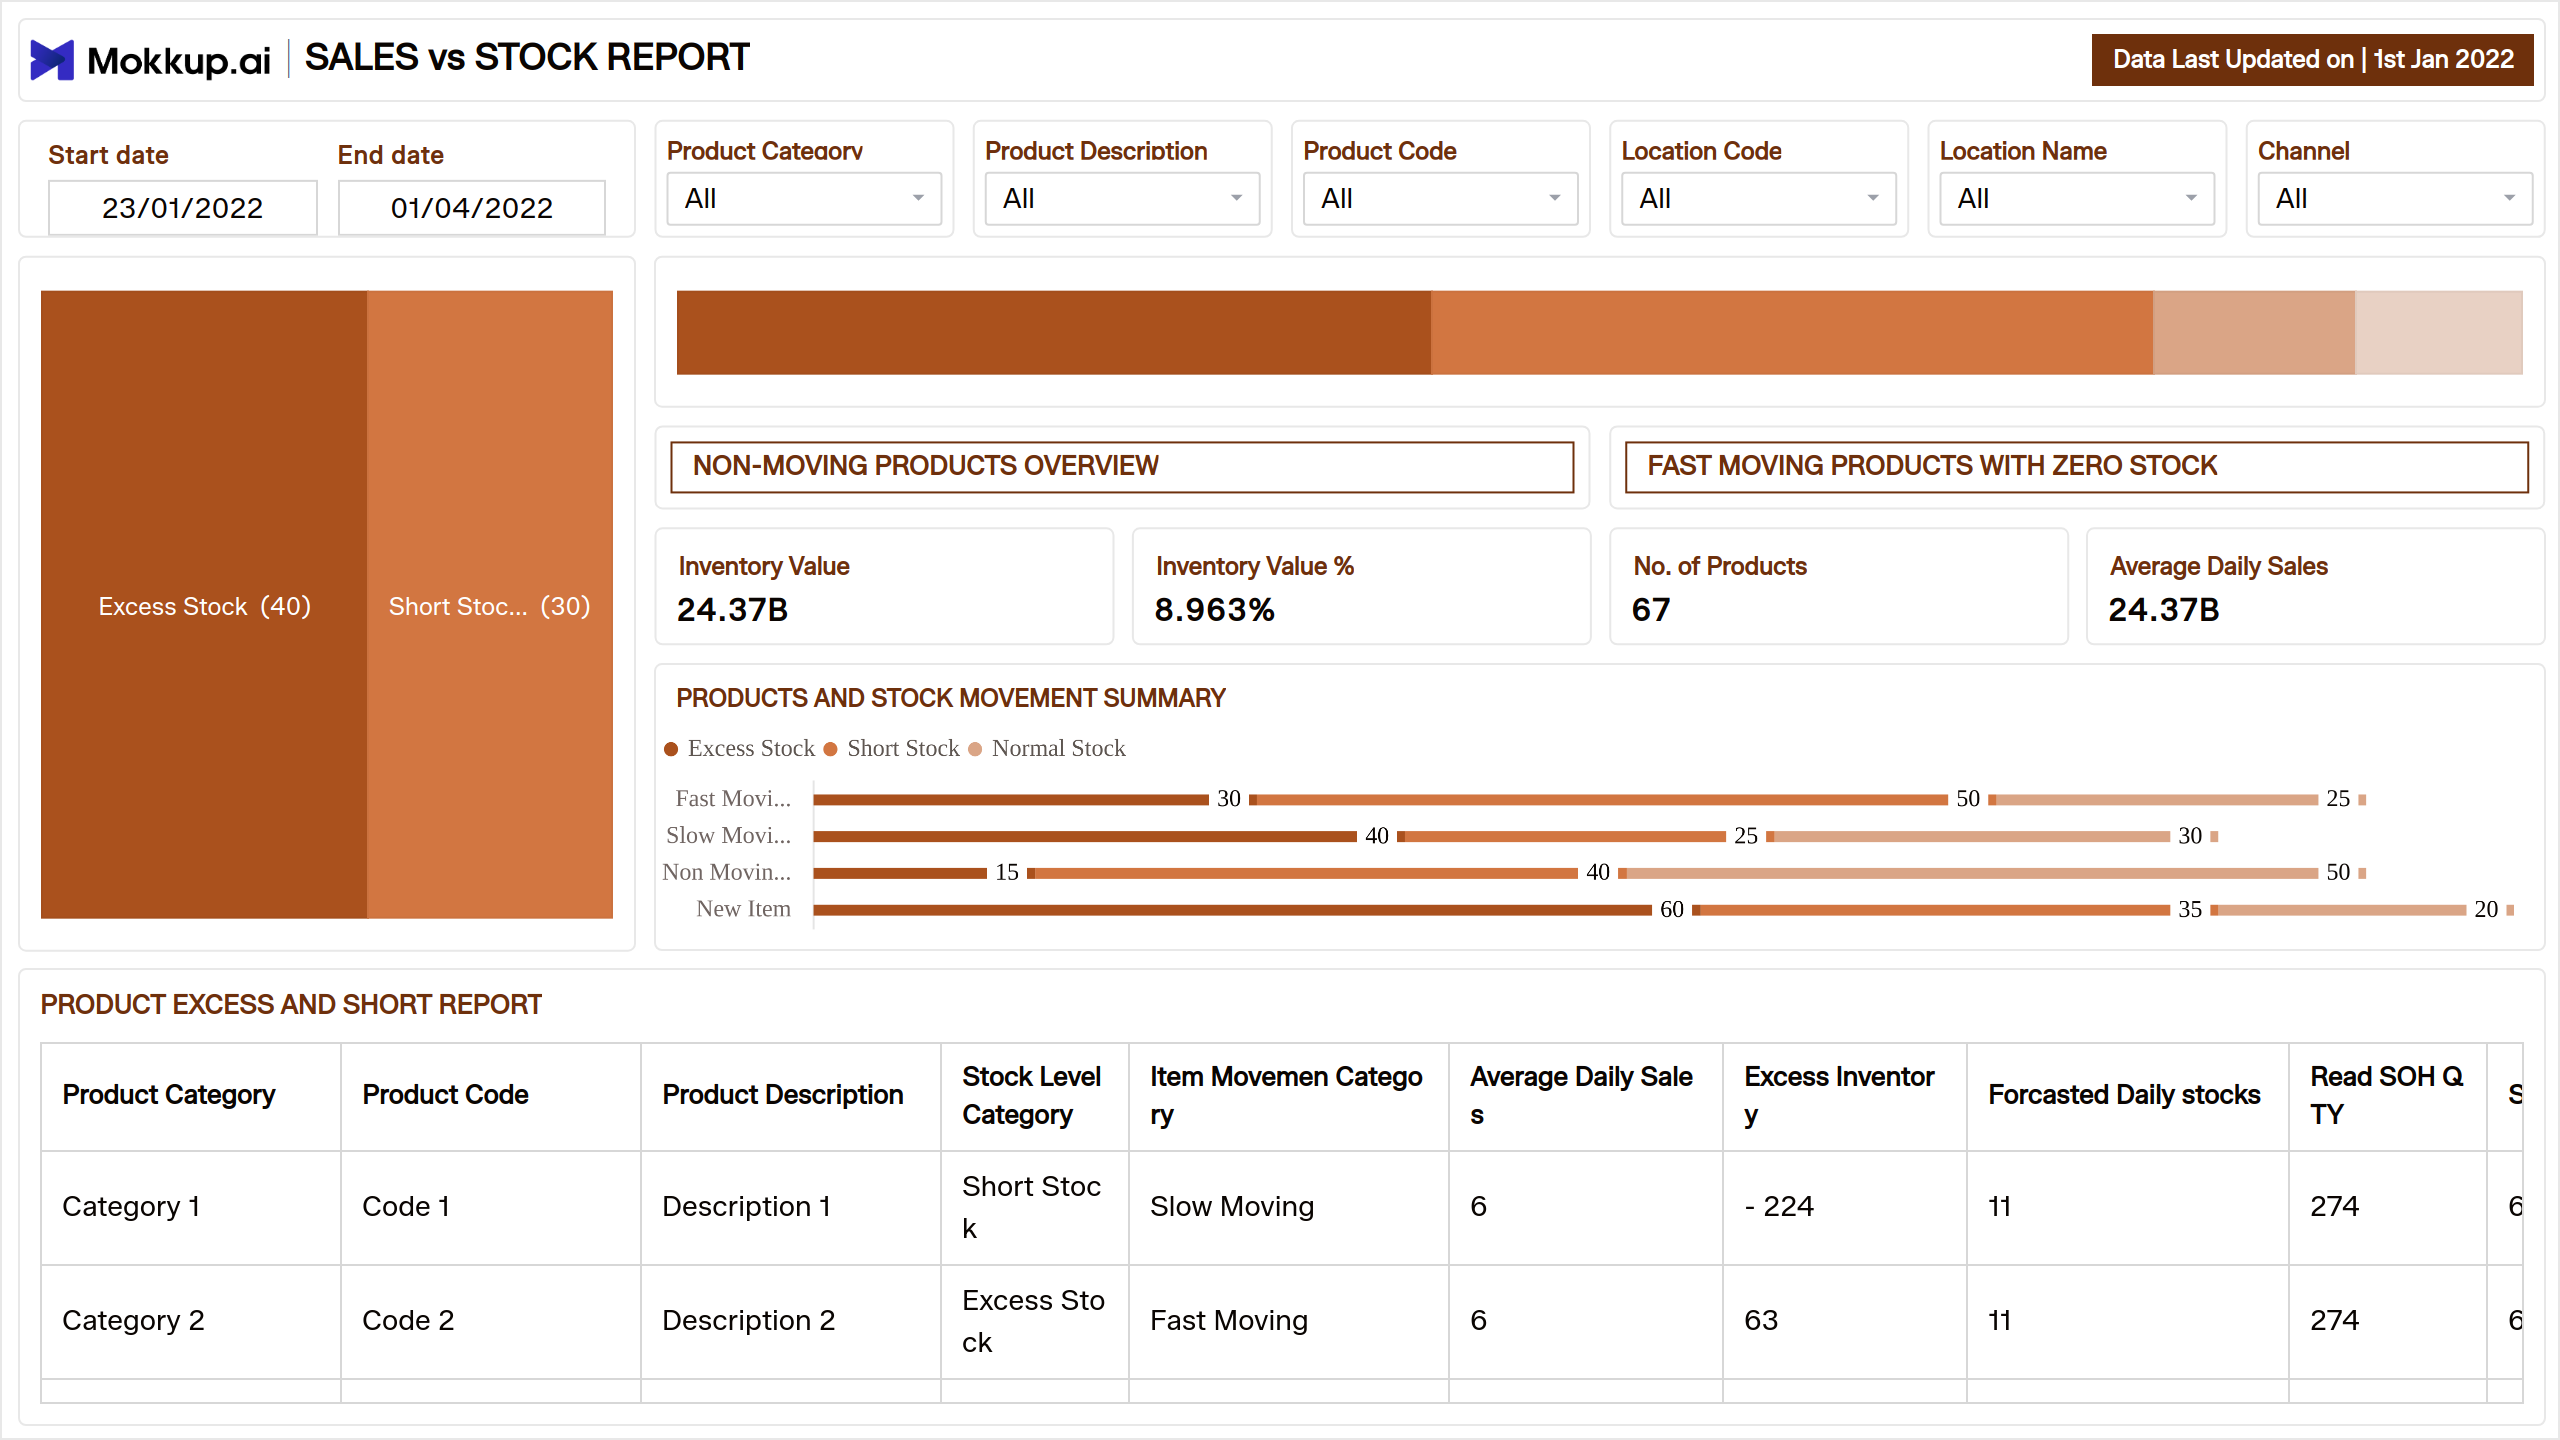
The Sales Vs Stock Report dashboard template offers a comprehensive view of inventory management, enabling organizations to make data-driven decisions and optimize their inventory processes. This dashboard wireframe typically includes several critical components:
- Current Stock Levels: Displays real-time data on the amount of inventory available for each product and helps in identifying which items are overstocked or understocked.
- Sales Trends: Visualizes historical sales data to reveal patterns and trends over time. Also, assists in forecasting future demand and planning inventory accordingly.
- Inventory Value: It shows the financial worth of the current inventory and helps in assessing the overall value of the stock and making informed financial decisions.
- Inventory Turnover: It measures how quickly inventory is sold and replaced over a specific period and provides insights into inventory efficiency and potential areas for improvement.
- Reorder Points: Indicates the minimum stock level at which a new order should be placed. It also prevents stockouts by ensuring timely replenishment of inventory.
- Stock-Out Risks: Identifies products at risk of running out of stock by helping in taking proactive measures to avoid disruptions in sales.
The Sales Vs Stock Dashboard wireframe assists organizations in improving their inventory management processes and achieving their inventory management goals by presenting this information in a visual and easily understandable format.
Key Terms to Know:
- Excess stock: Identify and reduce inventory that is not selling quickly.
- Short stock: Avoid lost sales by tracking and replenishing inventory that is running low.
- Non-moving products overview: Identify products that are not selling at all.
- Fast moving products with zero stock: Avoid stockouts of popular products.
- Product excess and short report: Generate a comprehensive report on excess and short stock levels.
- Products and stock movement summary: Track inventory movement over time to identify trends and patterns.
Dashboard Template Insights
The dashboard wireframe offers valuable insights to help organizations manage inventory more effectively and make informed decisions regarding stock levels and sales performance.
- The wireframe shows the current stock levels of each item, which helps organizations determine which items are in high demand and which items are slow-moving. It provides information on which stock or particular items are frequently sold and which items are slow-moving.
- It provides information on the current inventory's value, which can assist organizations in determining the financial value of their stock and making informed decisions about inventory investment.
- It provides inventory turnover data, which can assist organizations in determining how quickly their stock is sold and how efficient their inventory management is.
Conclusion
The Sales Vs Stock Report dashboard template is important for organizations looking to enhance their inventory management processes. By providing a visual and easily understandable representation of key inventory metrics, this dashboard helps organizations make informed decisions, optimize stock levels, and achieve their inventory management goals.