
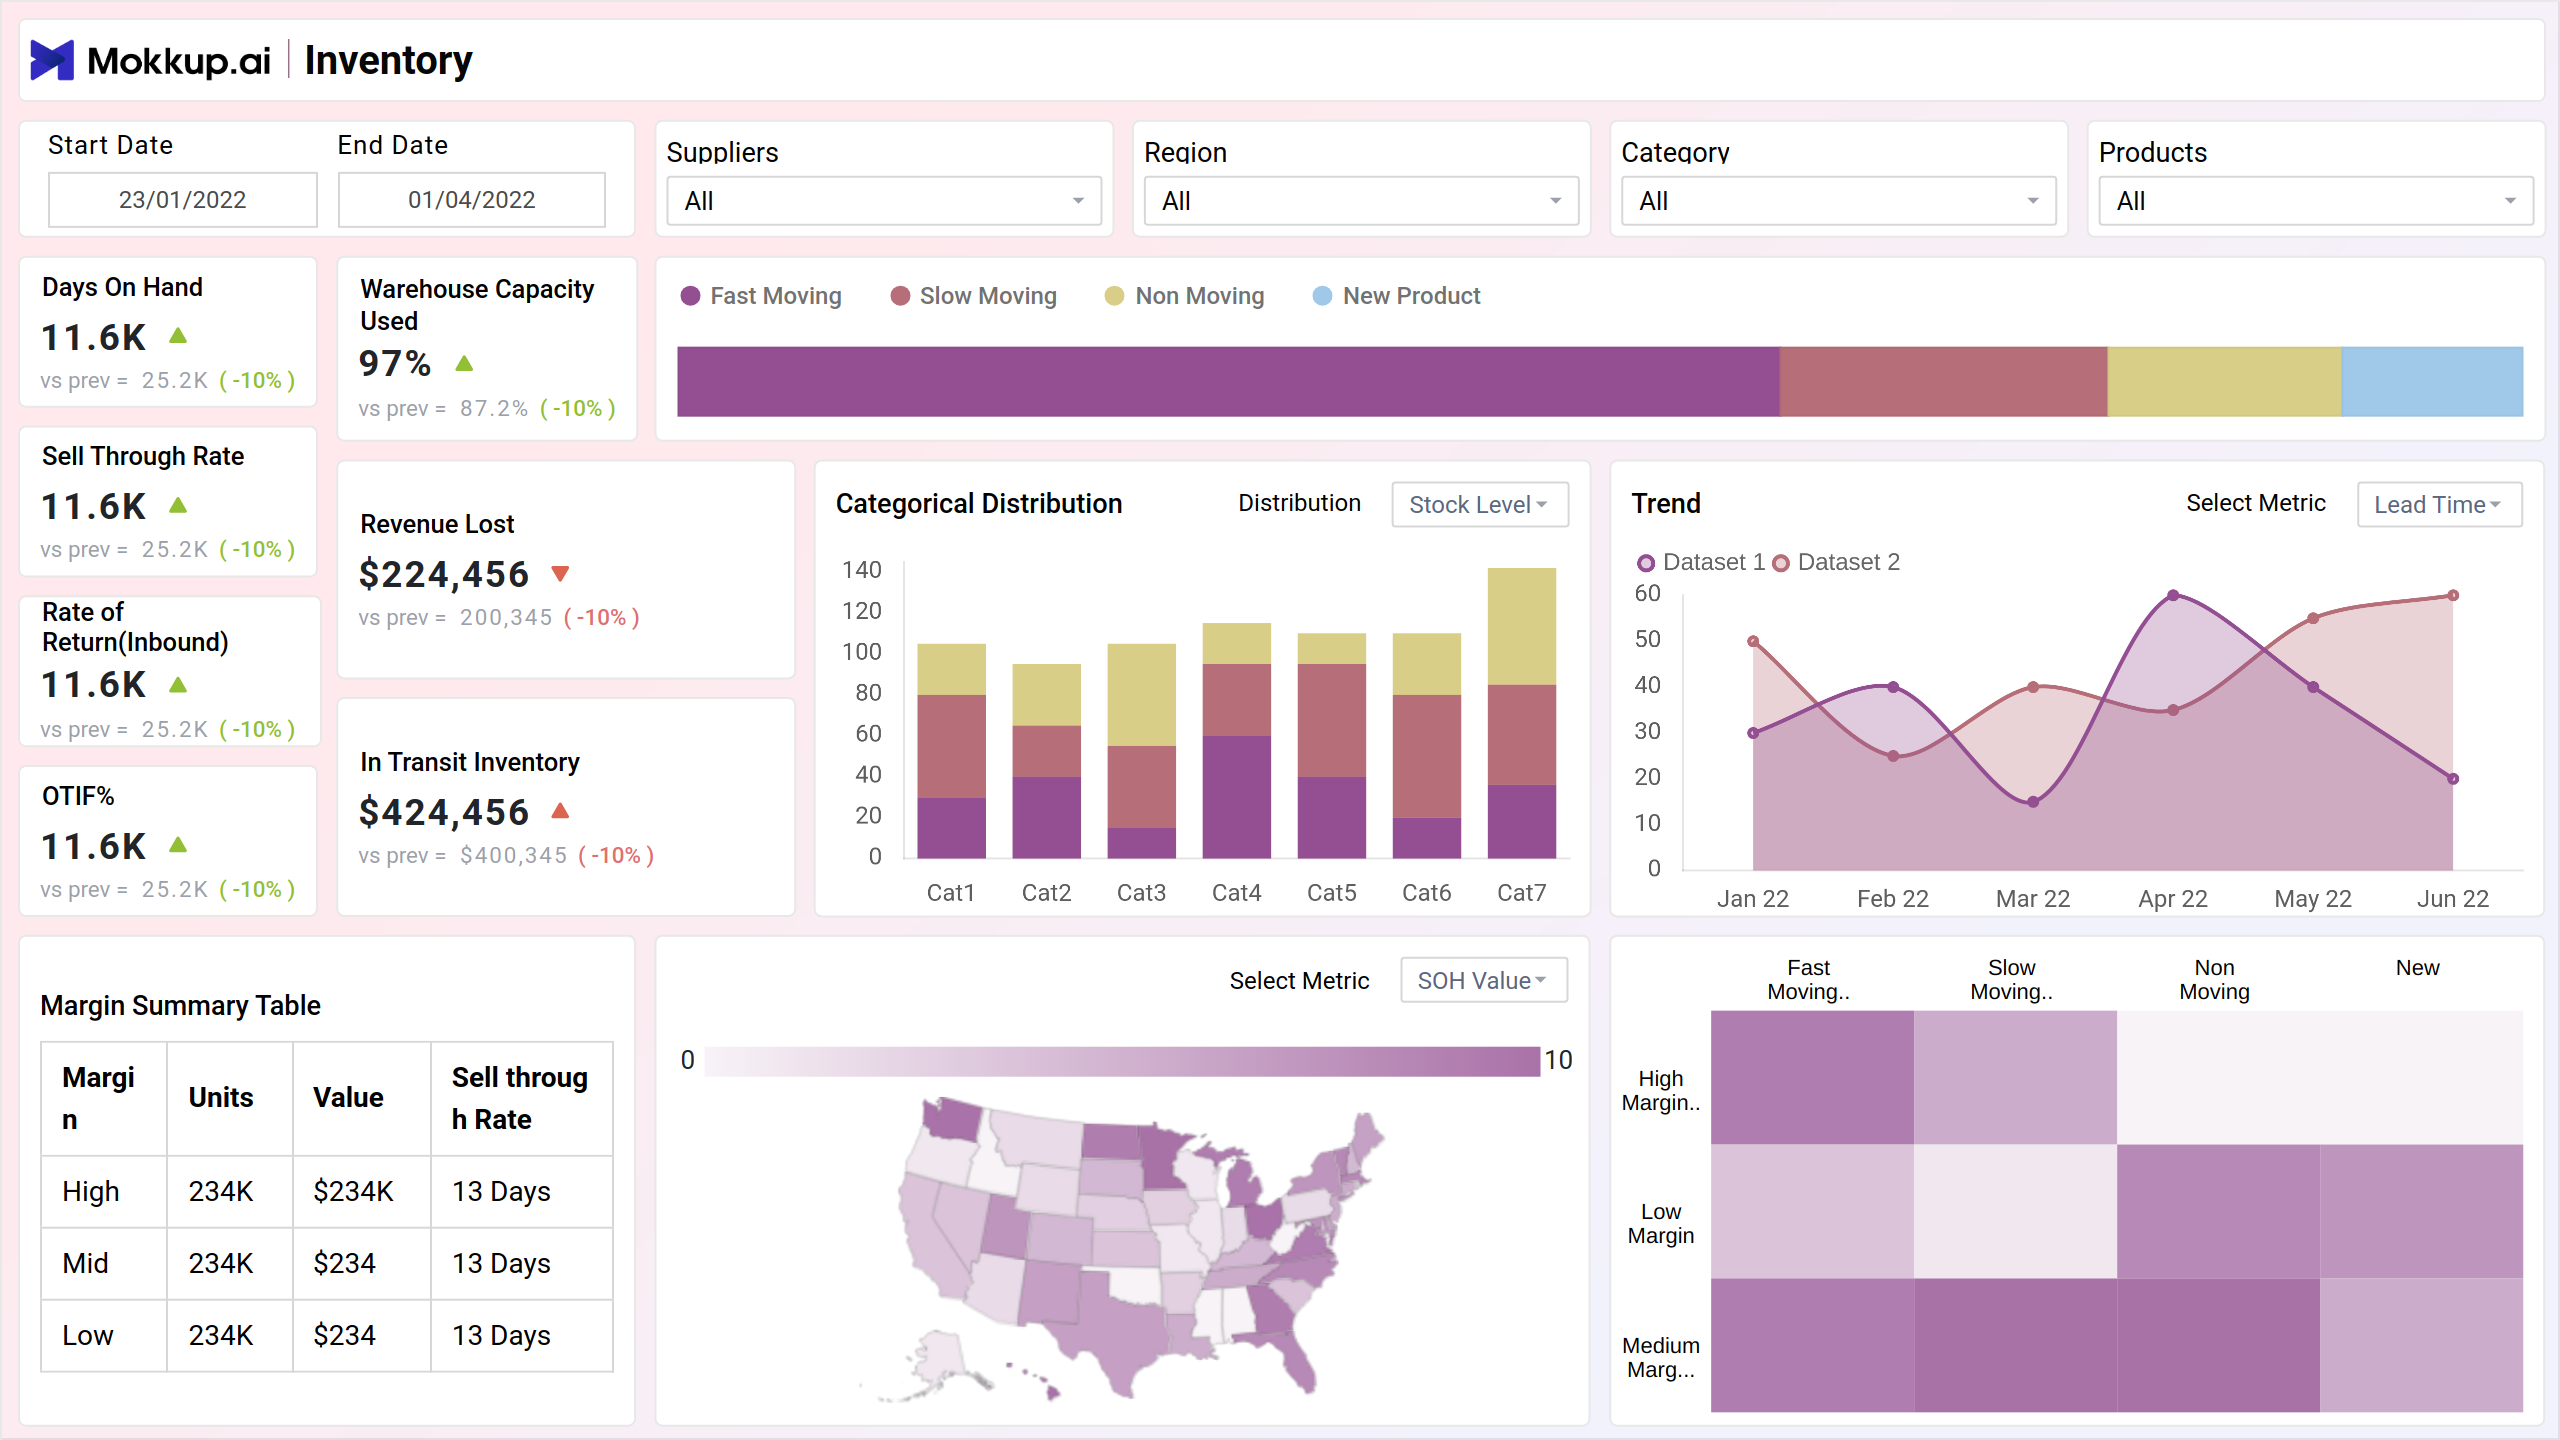
A Procurement Inventory dashboard template is a visual representation of key procurement and inventory metrics and data. It provides stakeholders with a quick overview of the status of procurement activities, inventory levels, purchasing trends, supplier performance, and more.
The procurement inventory dashboard wireframe provides a concise snapshot of essential metrics vital for efficient supply chain management. It offers real-time insights into inventory levels, warehouse capacity, supplier performance, and revenue impact.
This summary view enables stakeholders to quickly assess the health of the supply chain, identify areas for improvement, and drive strategic decision-making.
Key Terms to Know:
- Days on Hand: This metric indicates the number of days of inventory remaining based on current sales rates and inventory levels. It helps in assessing inventory management efficiency and identifying potential stock outs or overstock situations.
- Warehouse Capacity Used: It shows the percentage of warehouse capacity utilized, helping to optimize storage space and avoid overcrowding or underutilization.
- Sell Through Rate: This metric shows the rate at which inventory is being sold or utilized over a specific period, indicating demand and sales performance.
- Revenue Lost: Calculation showing the revenue lost due to stockouts or unfulfilled demand, helping to quantify the impact of inventory shortages on sales and profitability.
- Rate of Return (Inbound): Percentage of inbound shipments returned to suppliers due to issues such as quality defects, damages, or discrepancies. This metric assesses supplier performance and product quality.
- In Transit Inventory: This shows inventory currently in transit, including expected arrival dates and quantities. It helps in managing logistics and coordinating inventory replenishment.
- OTIF% (On-Time In-Full): Percentage of orders delivered on time and in full by suppliers. OTIF% is a key performance indicator for supplier reliability and fulfillment efficiency.
- Margin Summary Table: Summary of profit margins for different product categories or individual items, indicating the profitability of inventory sales.
- Categorical Distribution: Visualization showing the distribution of inventory across different categories or product types, helping to identify areas of focus for procurement and sales efforts.
This summary view provides stakeholders with a quick overview of critical procurement and inventory metrics, enabling informed decision-making and proactive management of supply chain operations.
Product View
The product view of the dashboard wireframe offers a succinct overview of individual product performance, including ROI, backorder rate, and lost revenue, alongside detailed inventory summaries.
Key Terms to Know:
- Return on Investment (ROI): Measures the profitability of individual products by comparing the return (revenue generated) to the investment (cost incurred). It helps assess the effectiveness of product investments and guides future allocation of resources.
- Backorder Rate: Indicates the percentage of customer orders that cannot be fulfilled immediately due to insufficient stock. A high backorder rate may suggest inventory shortages or inefficient supply chain processes.
- Lost Revenue: Quantifies the revenue lost due to stockouts or unfulfilled customer demand. By understanding the financial impact of inventory shortages, organizations can prioritize replenishment efforts and optimize inventory levels.
- Stock on Hand (SOH) Value: The total monetary value of inventory currently available for sale.
- Reorder Point: The inventory level at which a new order should be placed to avoid stockouts during lead time.
- Lead Time: The time it takes for a supplier to deliver goods after an order is placed.
- Stock Status: Indicates whether inventory levels are above, below, or at the desired levels, based on the reorder point.
These insights empower stakeholders to make informed decisions, streamline inventory levels, and boost operational efficiency.
Stock View
The stock view provides crucial information on stock status, including instances of stock outs, low stock levels, expected lost revenue, product popularity based on zero stock count, and reasons for stock outs.
Key Terms to Know:
- Stock Out: Indicates products that are currently out of stock, highlighting items that need immediate attention for replenishment to avoid lost sales opportunities.
- Low Stock: Identifies products with inventory levels below a predefined threshold, signaling the need for reordering to prevent stock outs and maintain customer satisfaction.
- Expected Lost Revenue: Estimates the potential revenue loss due to stock outs, providing insights into the financial impact of inventory shortages on sales performance.
- Product Popularity by Zero Stock Count: Analyzes the popularity of products based on the frequency of zero stock occurrences, helping prioritize inventory management efforts and identify high-demand items.
- Stock Out Reasons: Provides insights into the reasons behind stock outs, such as supplier delays, forecasting errors, or unexpected demand spikes, enabling proactive mitigation strategies and process improvements.
This overview helps in proactively managing inventory, minimizing revenue loss, and prioritizing replenishment efforts to meet demand efficiently.
Expiry View
The expiry-focused inventory view offers a comprehensive analysis of inventory management, emphasizing the month of expiry for proactive handling. It includes insights into Stock on Hand (SOH) value trends, highlights top products with batch numbers, and provides an inventory summary.
Key Terms to Know:
- Expiry Includes Month: Displays the expiry date of products, emphasizing the month of expiry to facilitate timely management and prevent product wastage.
- SOH Value Trend: Illustrates the trend of Stock on Hand (SOH) value over time, providing insights into inventory levels' fluctuations and helping identify patterns or anomalies.
- Top SOH Value Products with Batch Number: Lists products with the highest SOH values along with their respective batch numbers, aiding in efficient tracking and management of inventory.
- Inventory Summary: Provides a concise overview of inventory-related metrics, including total stock levels, expired products, upcoming expiries, and other relevant information to support informed decision-making and inventory management strategies.
These insights help stakeholders to effectively manage expiration dates, optimize inventory levels, and ensure product quality, thus enhancing operational efficiency and minimizing waste within the supply chain.
Dashboard Template Insights
The Procurement Inventory dashboard wireframe offers key insights that help streamline supply chain processes and improve procurement efficiency.
- It provides insights into critical supply chain metrics such as inventory levels, supplier performance, and purchasing trends.
- Stakeholders can utilize the dashboard wireframe to optimize procurement strategies, mitigate risks, and improve overall operational efficiency.
- Granular views, such as product-level analytics and expiry management, offer targeted insights to enhance inventory management and decision-making.
Conclusion
The Procurement Inventory dashboard template serves as a powerful template for organizations to drive informed decision-making and optimize supply chain operations. By leveraging real-time data and actionable insights, stakeholders can proactively address challenges, streamline procurement processes, and ultimately achieve greater efficiency and competitiveness in the market.