
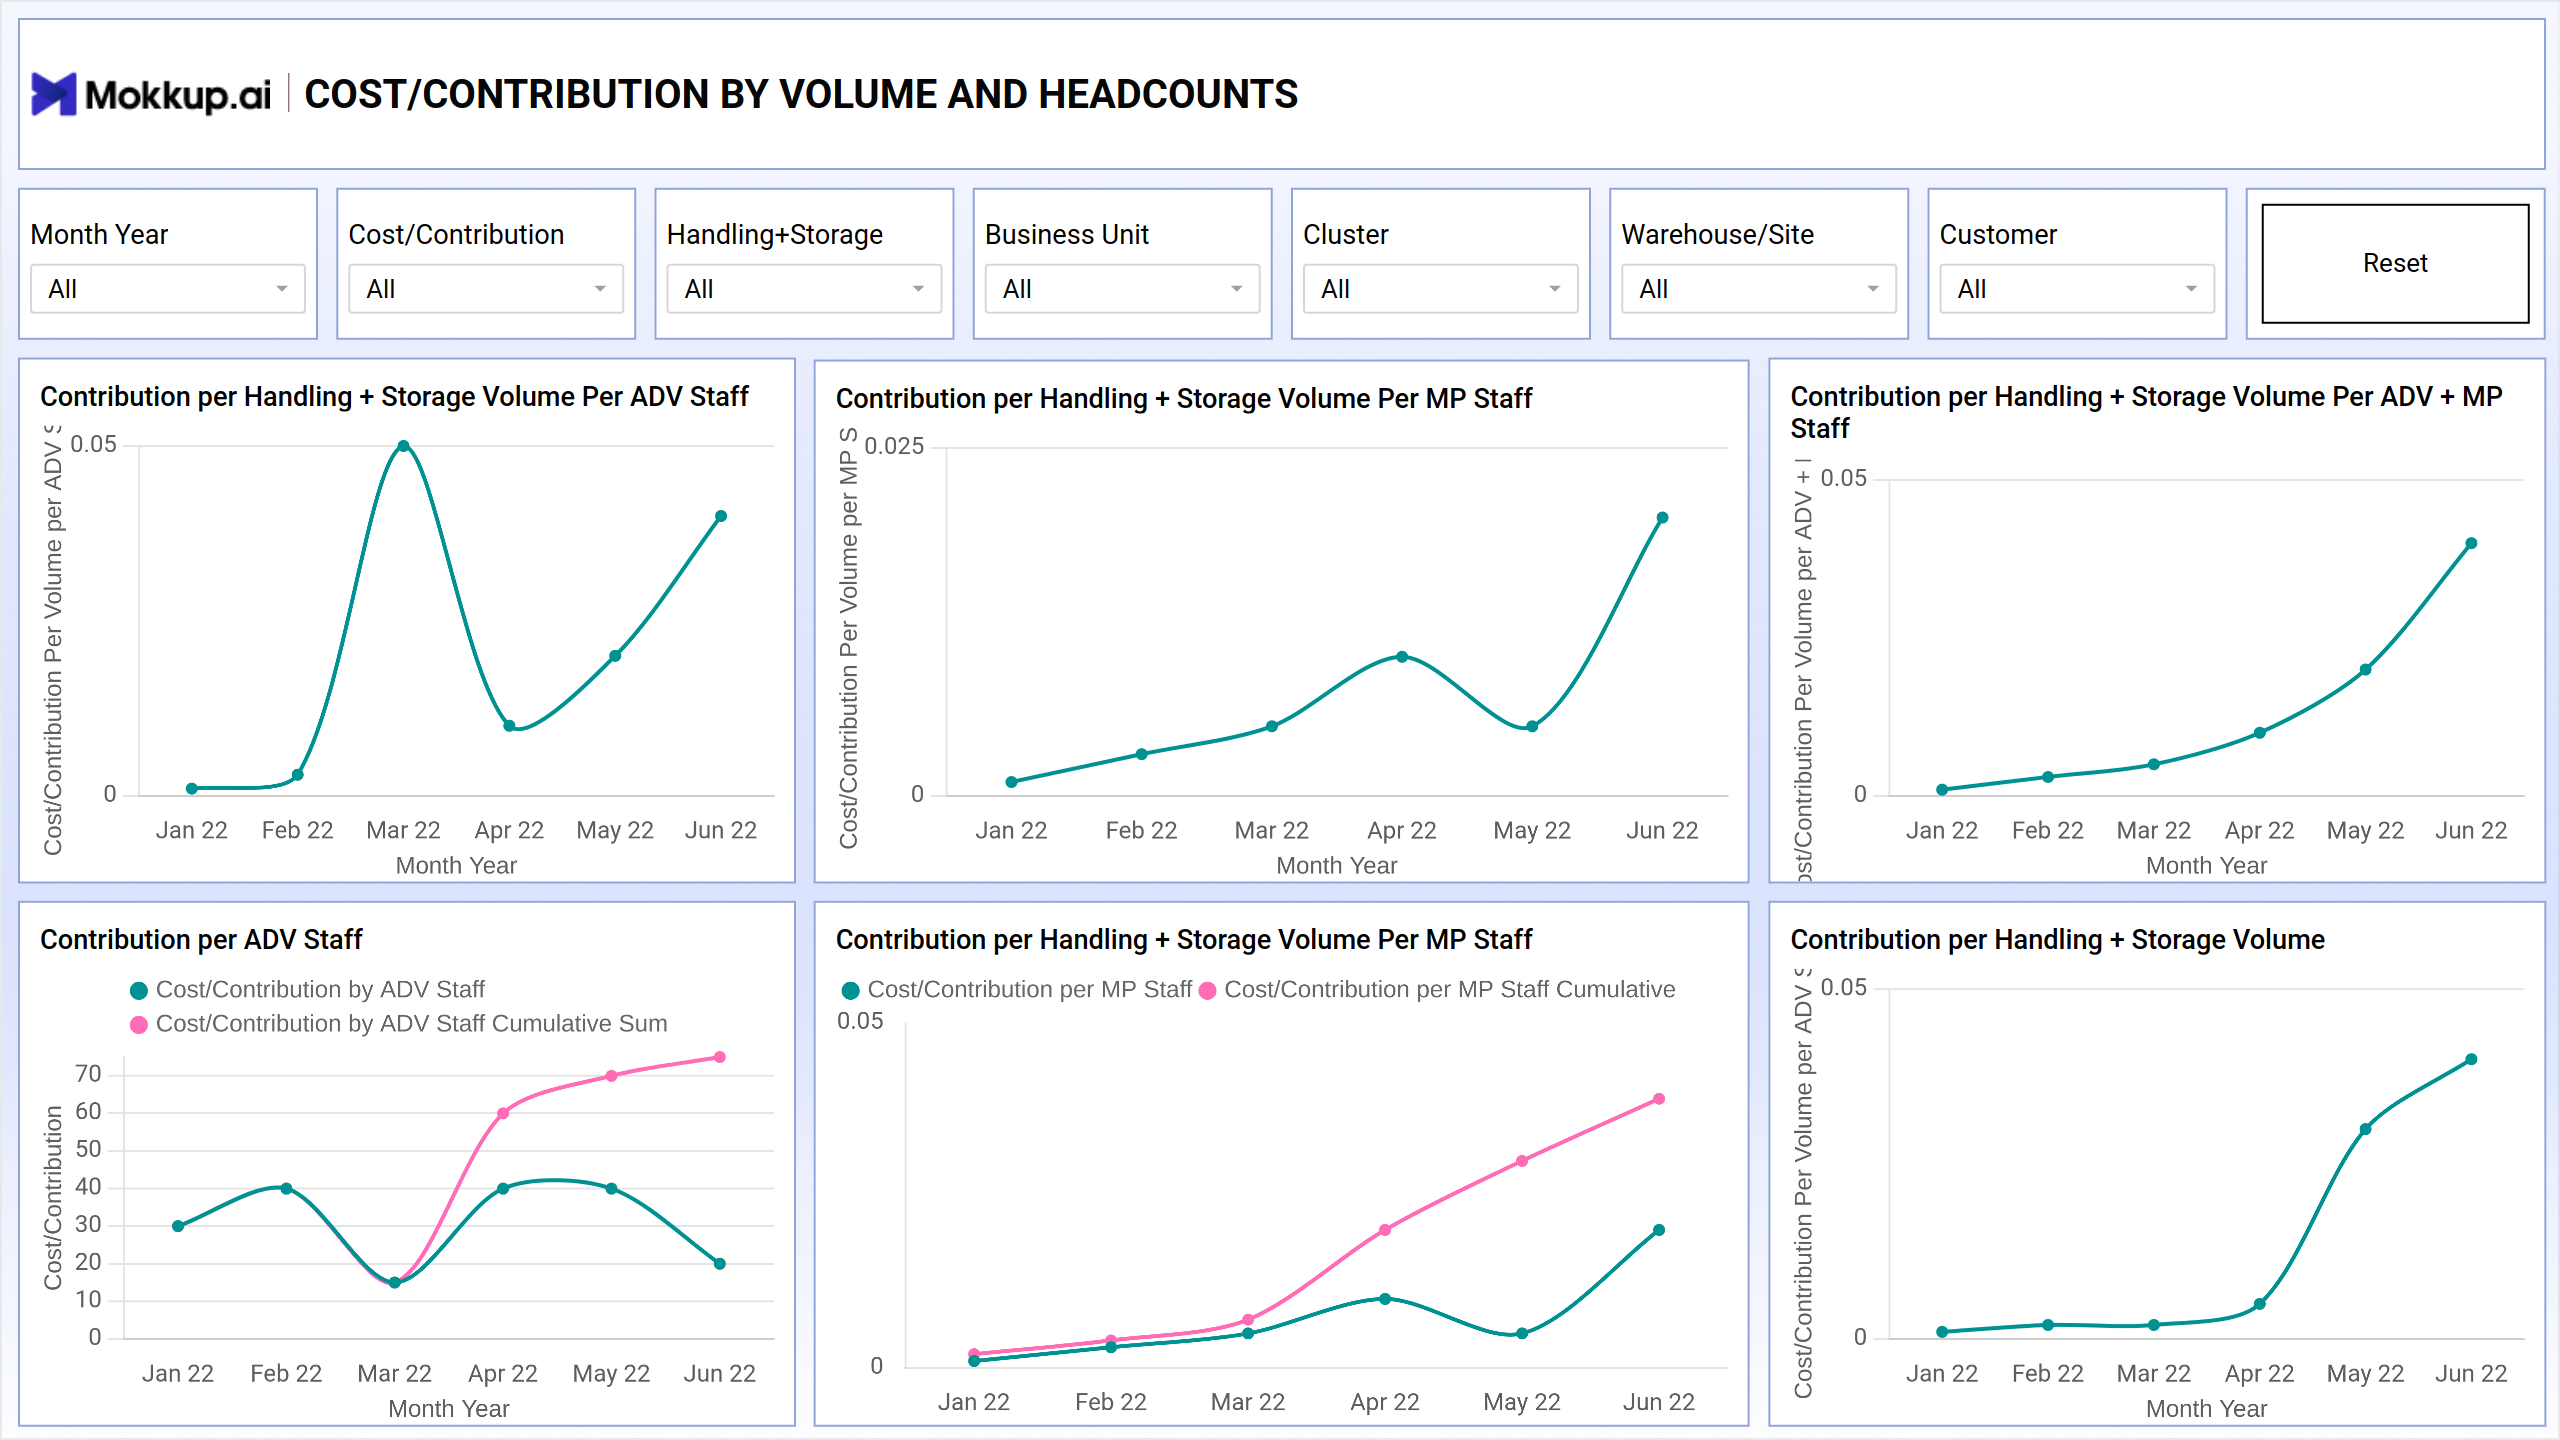
A Volume and Headcount Analytics dashboard template gives insights and analysis into the relationship between the volume of business activities and the corresponding headcount or workforce size within an organization. The dashboard wireframe offers key performance indicators (KPIs) and metrics related to workforce size, such as employee count, staffing levels, or labor productivity.
Cost/Contribution By Volume and Headcounts
Screen 1 offers a comprehensive view of contribution metrics per handling and storage volume, providing insights into workforce efficiency and revenue generation in handling and storage operations.
Key Terms to Know
- Contribution per Handling + Storage Volume per ADV Staff: Analyzes the cost contribution generated per unit of handling and storage volume attributed to Advanced (ADV) staff members.
- Contribution per Handling + Storage Volume per MP Staff: Examines the cost contribution generated per unit of handling and storage volume associated with Mid-level Professional (MP) staff members.
- Contribution per Handling + Storage Volume per ADV Staff + Storage Volume per MP Staff: Provides a combined analysis of the cost contribution generated per unit of handling and storage volume attributed to both ADV and MP staff members.
- Contribution per ADV Staff: Focuses on the cost contribution generated by each Advanced (ADV) staff member individually.
- Contribution per Handling + Storage Volume: Offers insights into the overall cost contribution generated per unit of handling and storage volume.
These metrics enable stakeholders to evaluate workforce productivity, optimize staffing levels, and identify opportunities for enhancing revenue generation and cost-efficiency in handling and storage operations.
Cost/Contribution By Volume and Headcounts
Screen 2 provides a summary table consolidating essential metrics such as cost, contribution, handling volume, storage volume, and staffing details for Advanced (ADV) and Mid-level Professional (MP) staff.
Key Terms to Know
- Cost: Total expenses incurred within the operations, providing an overview of the financial expenditure.
- Contribution: Revenue generated or contribution to profits from the operations, helping in evaluating profitability.
- Handling Volume: Total volume of goods or materials handled by the organization, indicating the scale of operational activities.
- Storage Volume: Total volume of goods or materials stored by the organization, reflecting the capacity and utilization of storage facilities.
- ADV Staff: Number of employees categorized as Advanced (ADV) staff, representing a specific skill level or responsibility within the workforce.
- MP Staff: Number of employees categorized as Mid-level Professional (MP) staff, indicating another tier of skill or responsibility within the workforce.
This concise overview offers stakeholders valuable insights into operational performance and resource utilization within the organization.
Financial Components Vs Volume Fluctuation and Man Hours/ Man Days
Screen 3 offers detailed insights into the relationship between financial components, volume fluctuations, and workforce productivity.
Key Terms to Know
- Cost per Entity FY 2021-22: Breakdown of costs associated with each entity or department for the fiscal year 2021-22, including financial components and revenue generated.
- Cost vs Revenue Trend: Analysis of the trend in costs versus revenue over time for each financial component, providing insights into financial performance and profitability trends.
- Cost per Man Days and Man Hours: Evaluation of costs per man days and man hours for each financial component, enabling assessment of labor costs and efficiency in resource utilization.
- Cost per CBM: Calculation of costs per Cubic Meter (CBM) for each financial component, offering insights into the cost efficiency of volume-related operations.
These metrics can help assess financial performance, optimize resource allocation, and identify areas for improvement in cost management and operational efficiency.
Financial Components Vs Volume Fluctuation and Man Hours/ Man Days
Screen 4 of the dashboard wireframe provides metrics including contribution per man hours/man days, contribution per entity, contribution per SKU count, and the trend of contribution compared to revenue.
Key Terms to Know
- Contribution per Man Hours/Man Days: Analysis of the contribution generated per unit of man hours or man days, providing insights into labor efficiency and productivity.
- Contribution per Entity: Summary of contributions from each entity or department, offering insights into revenue generation and performance across different segments of the organization.
- Contribution per SKU Count: Evaluation of contribution per Stock Keeping Unit (SKU) count, indicating the revenue generated per product or service unit.
- Contribution vs Revenue Trend: Trend analysis comparing contribution and revenue over time, highlighting changes in profitability and financial performance.
- Man Hours: Refer to the total hours worked by one person within a specific time frame, typically within a day, week, month, or year.
- Man Days: It is used to measure work done by a group of people collectively over a single day. It is calculated by multiplying the number of workers by the number of days worked.
- SKU: Stands for "Stock Keeping Unit." It is a unique code or identifier assigned to each distinct product or service in a company's inventory or catalog. SKUs are used to track and manage inventory levels, sales, and other related data.
It helps to assess labor productivity and resource utilization efficiency individually for each time unit.
Dashboard Template Insights
The dashboard wireframe helps with:
- Monitoring the workforce productivity and operational volume relationship, optimizing staffing levels, and enhancing efficiency
- Analyzing the cost and contribution of various financial components concerning volume and headcounts, enhancing understanding of the organization's financial health.
- Identifying trends and patterns in workforce productivity and operational volumes guides strategic decision-making and resource allocation.
- Providing a comprehensive view of the organization's financial components, volume fluctuations, and workforce productivity facilitates an informed, data-driven approach to managing operations and costs.
Conclusion
Utilizing the analytics dashboard wireframe for volume and headcount helps in making informed decisions by maximizing staffing, understanding financial dynamics, and directing the strategic deployment of resources, all of which improve operational effectiveness and cost control within the company.