A CRM analytics dashboard template provides comprehensive insights into customer relationship management (CRM) data. It aggregates and presents key CRM metrics, trends, and performance indicators in an easy-to-understand format. This allows businesses to monitor and analyze their customer interactions, sales activities, and marketing campaigns effectively.
Key Terms to Know
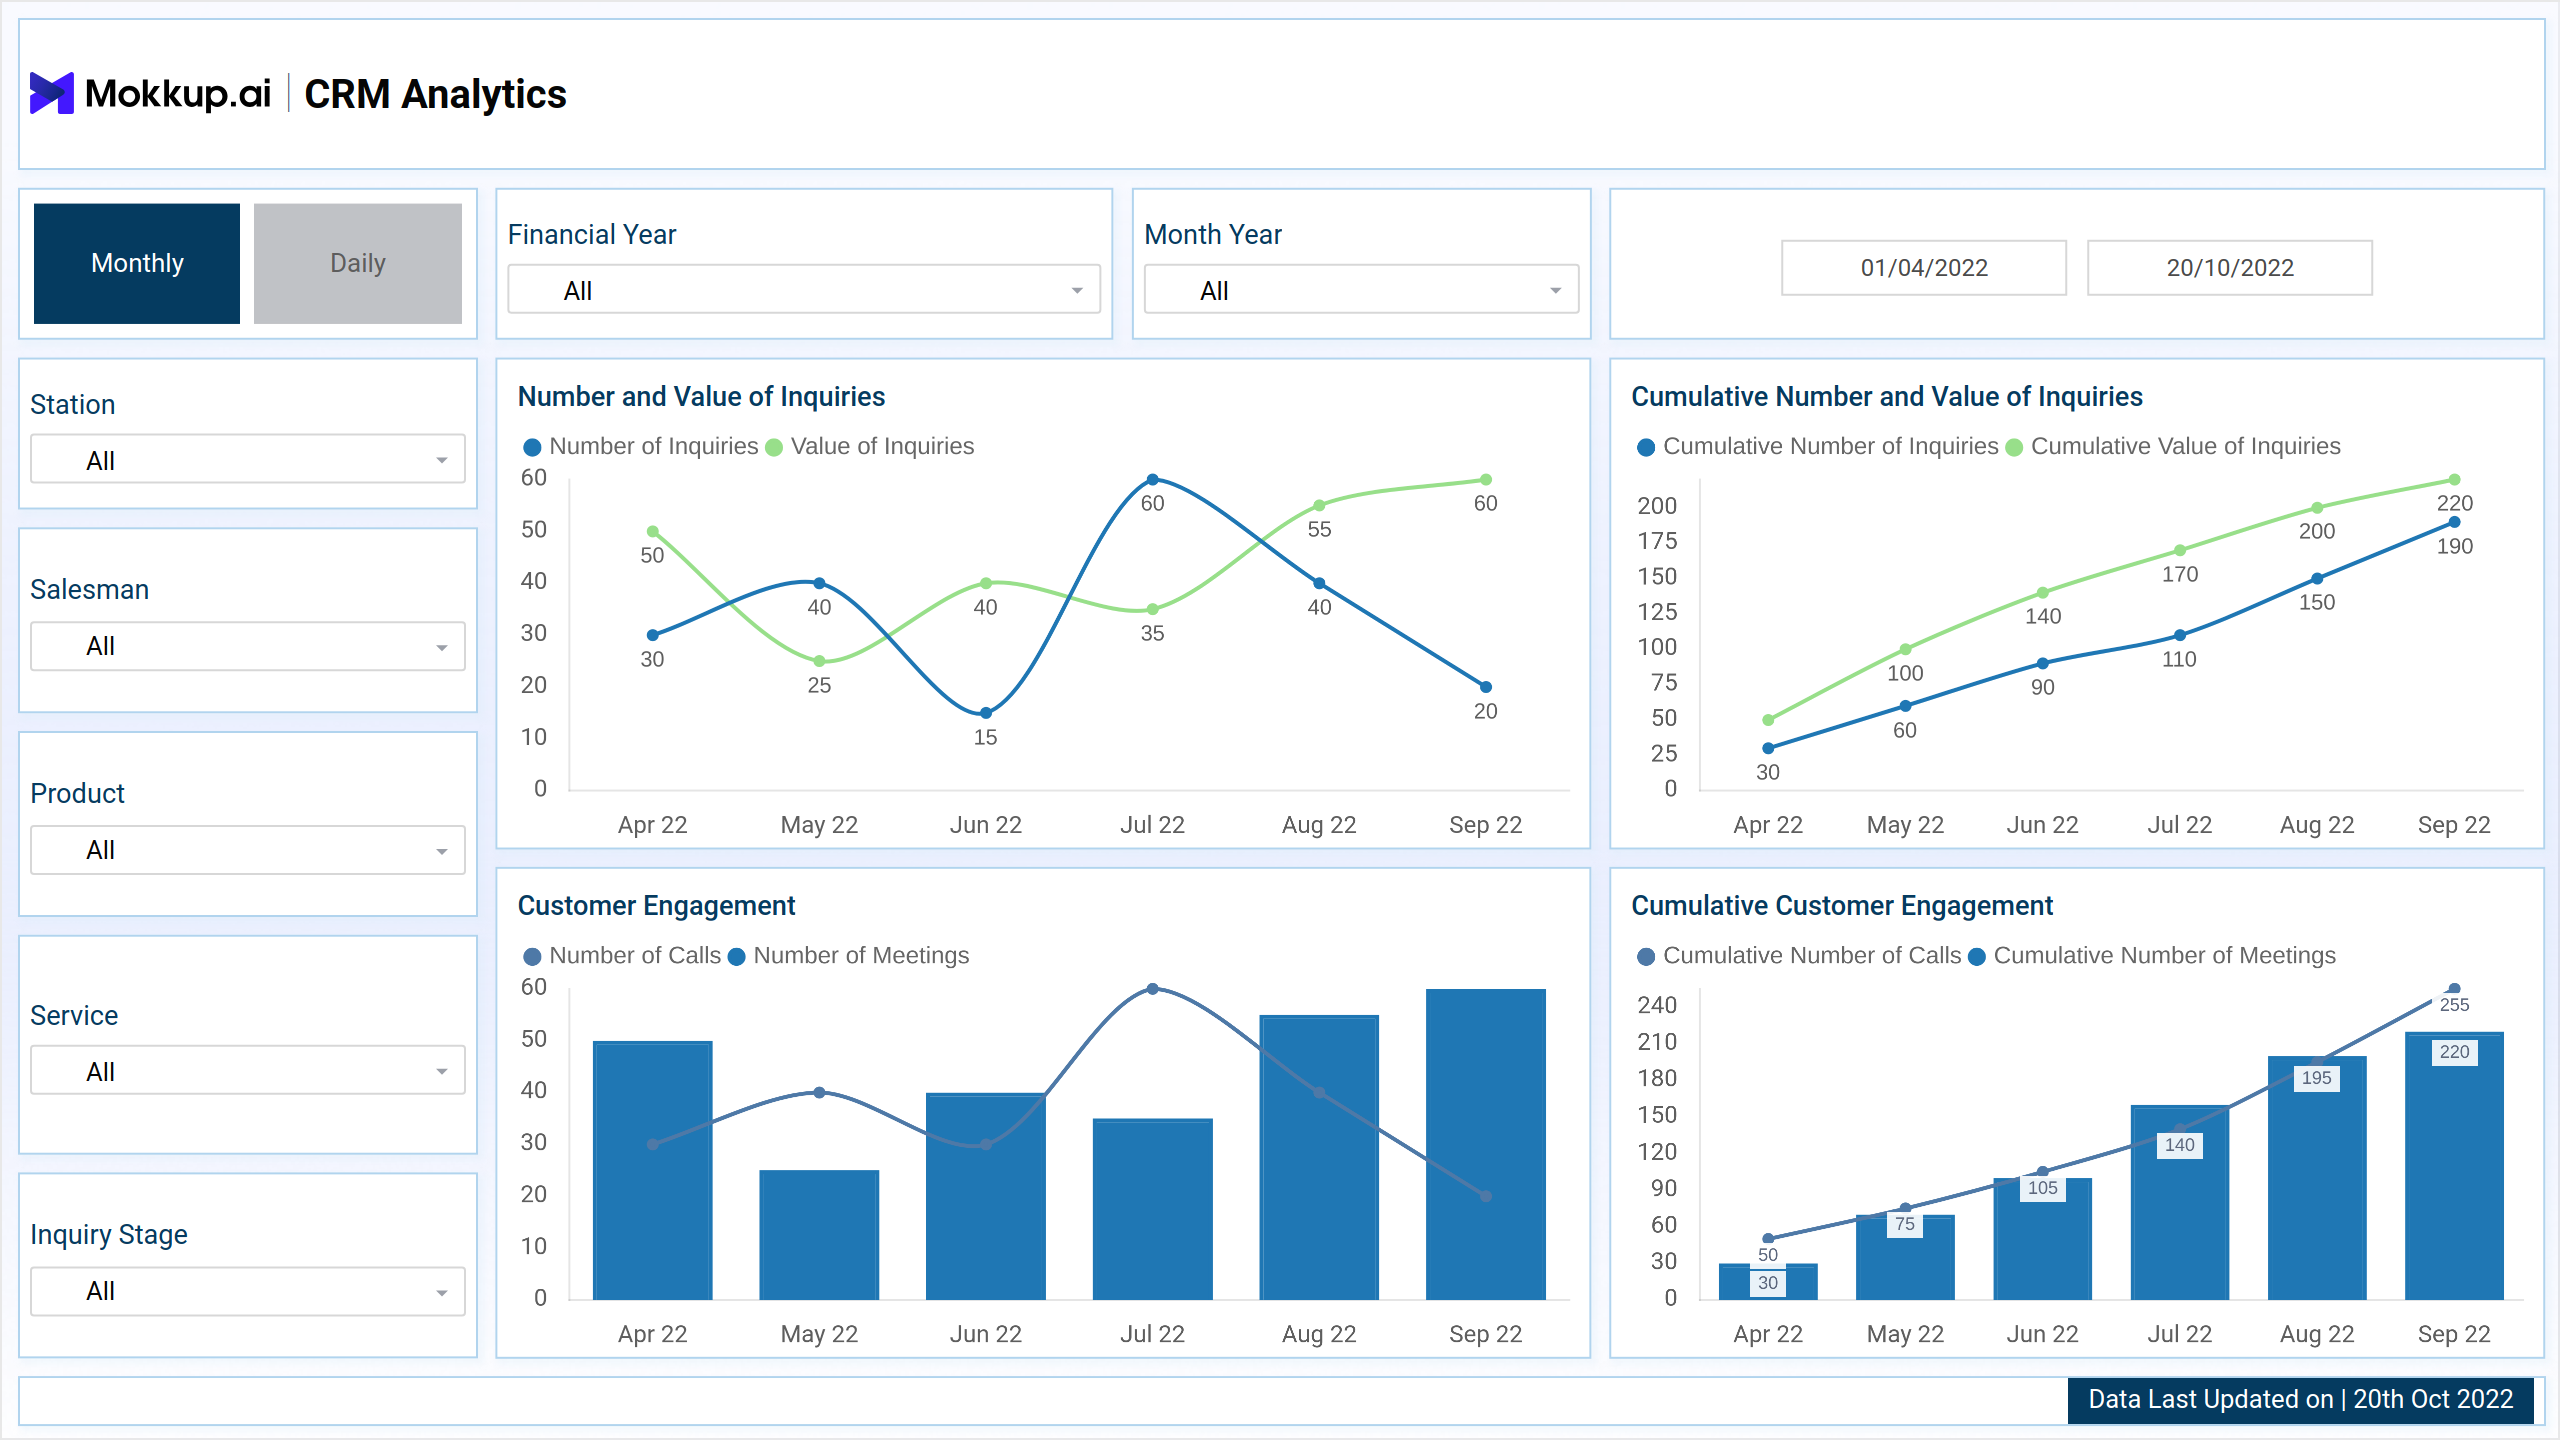
- Number and Value of Inquiries: This metric tracks the total number of inquiries received by the business, along with their respective values (e.g., monetary value of products or services requested). This helps businesses understand the volume and potential revenue of incoming customer queries.
- Cumulative Number and Value of Inquiries: Cumulative values showcase the overall trend of inquiries and their associated values over a specified period. This provides insights into demand patterns and revenue potential.
- Customer Engagement: Customer engagement metrics measure the level of interaction and involvement that customers have with the business. This includes activities such as website visits, social media interactions, and email responses.
- Cumulative Customer Engagement: This metric shows the overall engagement levels over time, indicating trends in customer interactions and relationship-building efforts.
Dashboard Template Insights
Here are the key takeaways of a CRM analytics dashboard wireframe:
- It provides a centralized view of crucial customer metrics, offering a holistic perspective on customer interactions, sales activities, and marketing campaigns.
- By presenting aggregated CRM data in an intuitive format, the dashboard wireframe aids in informed decision-making. Businesses can quickly identify trends, spot potential issues, and make data-driven decisions.
- The insights gained from a CRM analytics dashboard support strategic planning efforts. They help businesses develop targeted marketing campaigns, allocate resources more effectively, and set realistic sales goals.
- Enhanced visibility into customer interactions and engagement metrics allows businesses to improve customer relationships. Understanding customer preferences enables businesses to tailor their communication and service approaches.
- Using a CRM analytics dashboard wireframe drives business growth. By efficiently harnessing customer data, businesses can enhance sales and marketing strategies, improve customer satisfaction, and foster loyalty, leading to increased revenue and sustained growth.
Conclusion
Using a CRM analytics dashboard template enables businesses to harness customer data efficiently, enhance sales and marketing strategies, and provide tailored experiences that enhance customer satisfaction and foster loyalty within a dynamic market environment. By transforming data into actionable insights, businesses can make informed decisions that drive growth and ensure long-term success.