

How to Use Mokkup.ai: A Quick Tour
Welcome to Mokkup.ai! Create stunning dashboards in minutes. Mokkup.ai helps you present your data in a visually appealing manner to help you with compelling data storytelling and visualization.
To get you familiar with the Mokkup.ai user interface, Let's start a quick guide tour.
Sidebar
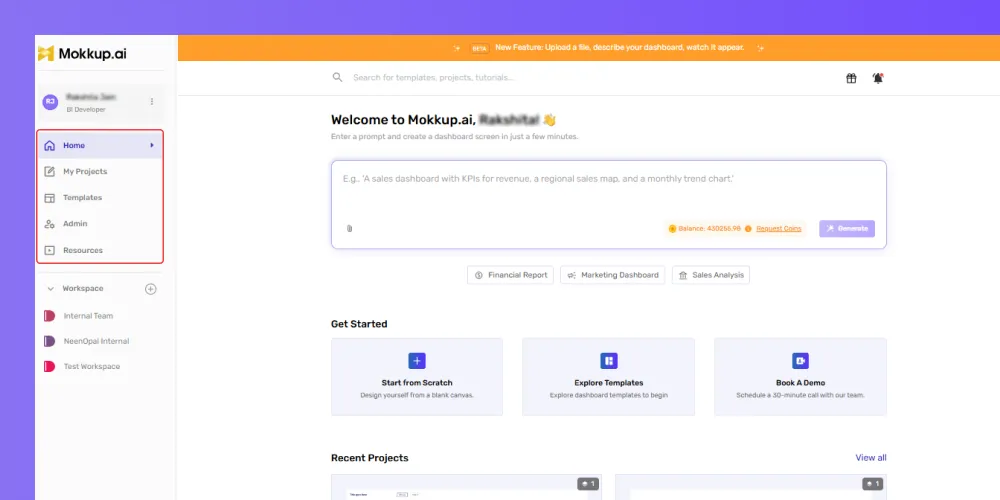
The sidebar provides access to your account settings, projects, templates, and resources.
Besides your name, you can see the three dots; from there, you can manage your account and carry out a few other activities, such as shown below.
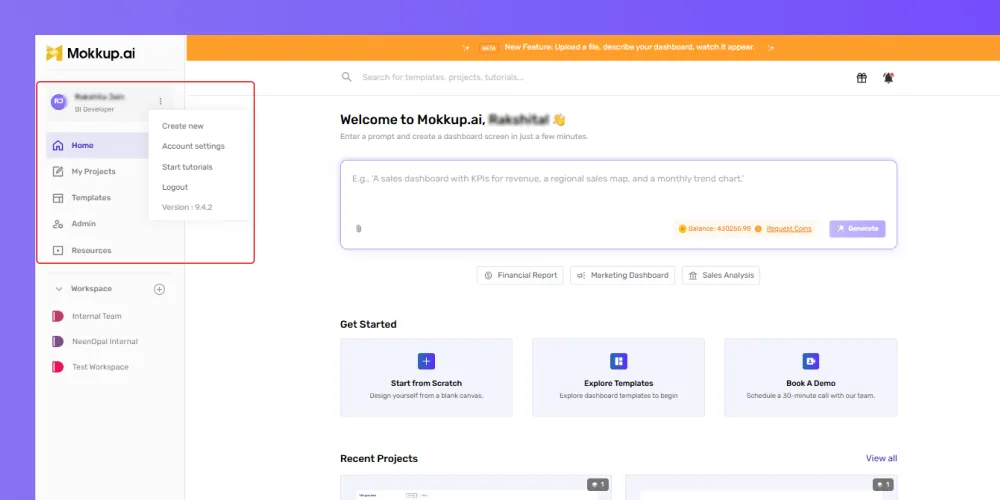
- You can create your personalized dashboard by selecting the “Create new” option.
- In "Account settings," you can update your general information, change your email address or password, and even deactivate your Mokkup account.
- “Start tutorials” will give you small popups with information about the options on the sidebar.
- “Logout” will sign you out of your Mokkup.ai account.
1. Home
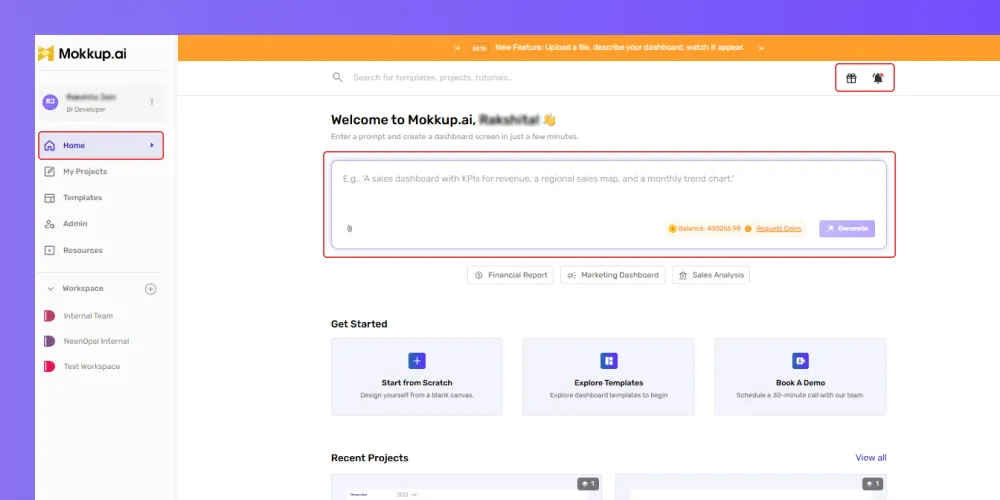
The home option will take you to the main home page of the Mokkup app. This is your central starting point for creating projects, browsing templates, and generating dashboards with AI.
2. My Projects
All your drafts and saved projects are located in the "Active" section, where you can access and edit them anytime.
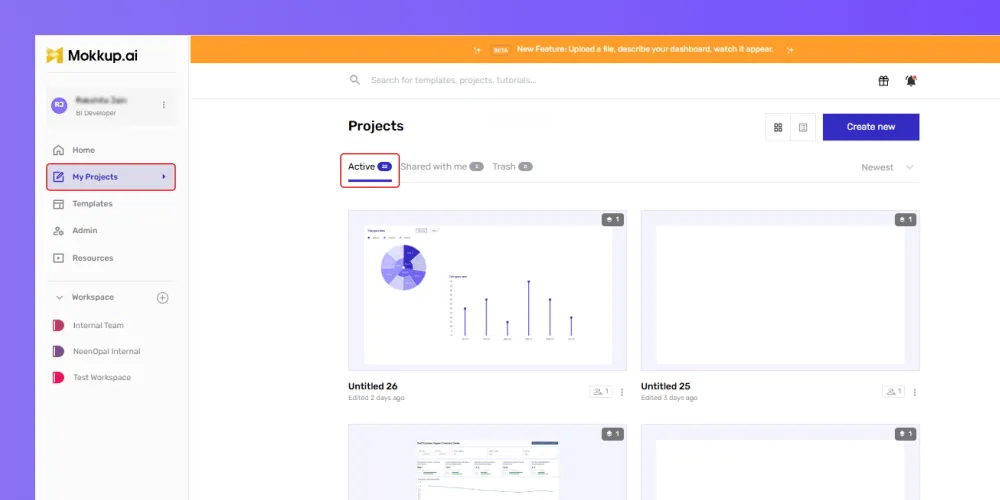
Shared with me
Projects shared by different team members can be accessed from here.
Trash
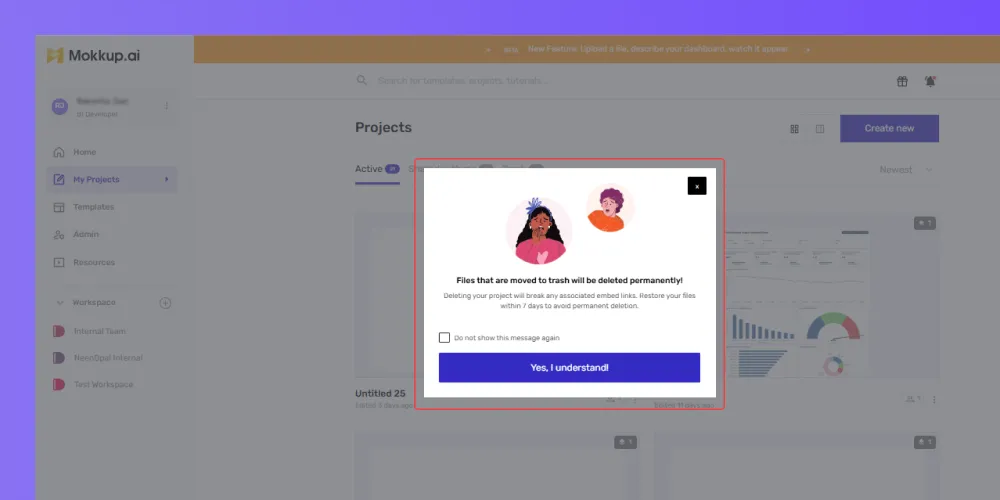
Deleted projects will be moved to the “Trash” and will be permanently deleted after 7 days.
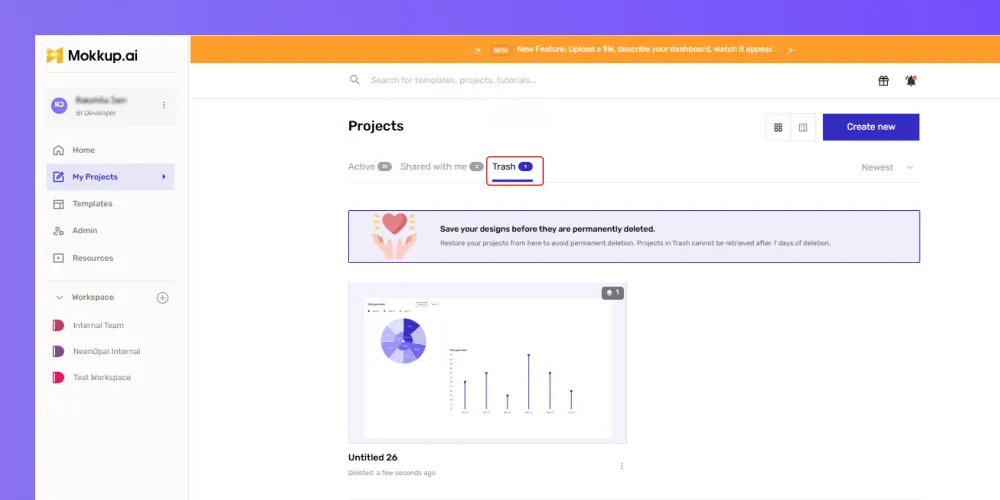
A warning alert will appear when you delete your project. If you click on the “Yes, I understand” button, your project will be moved to the trash folder.
3. Templates
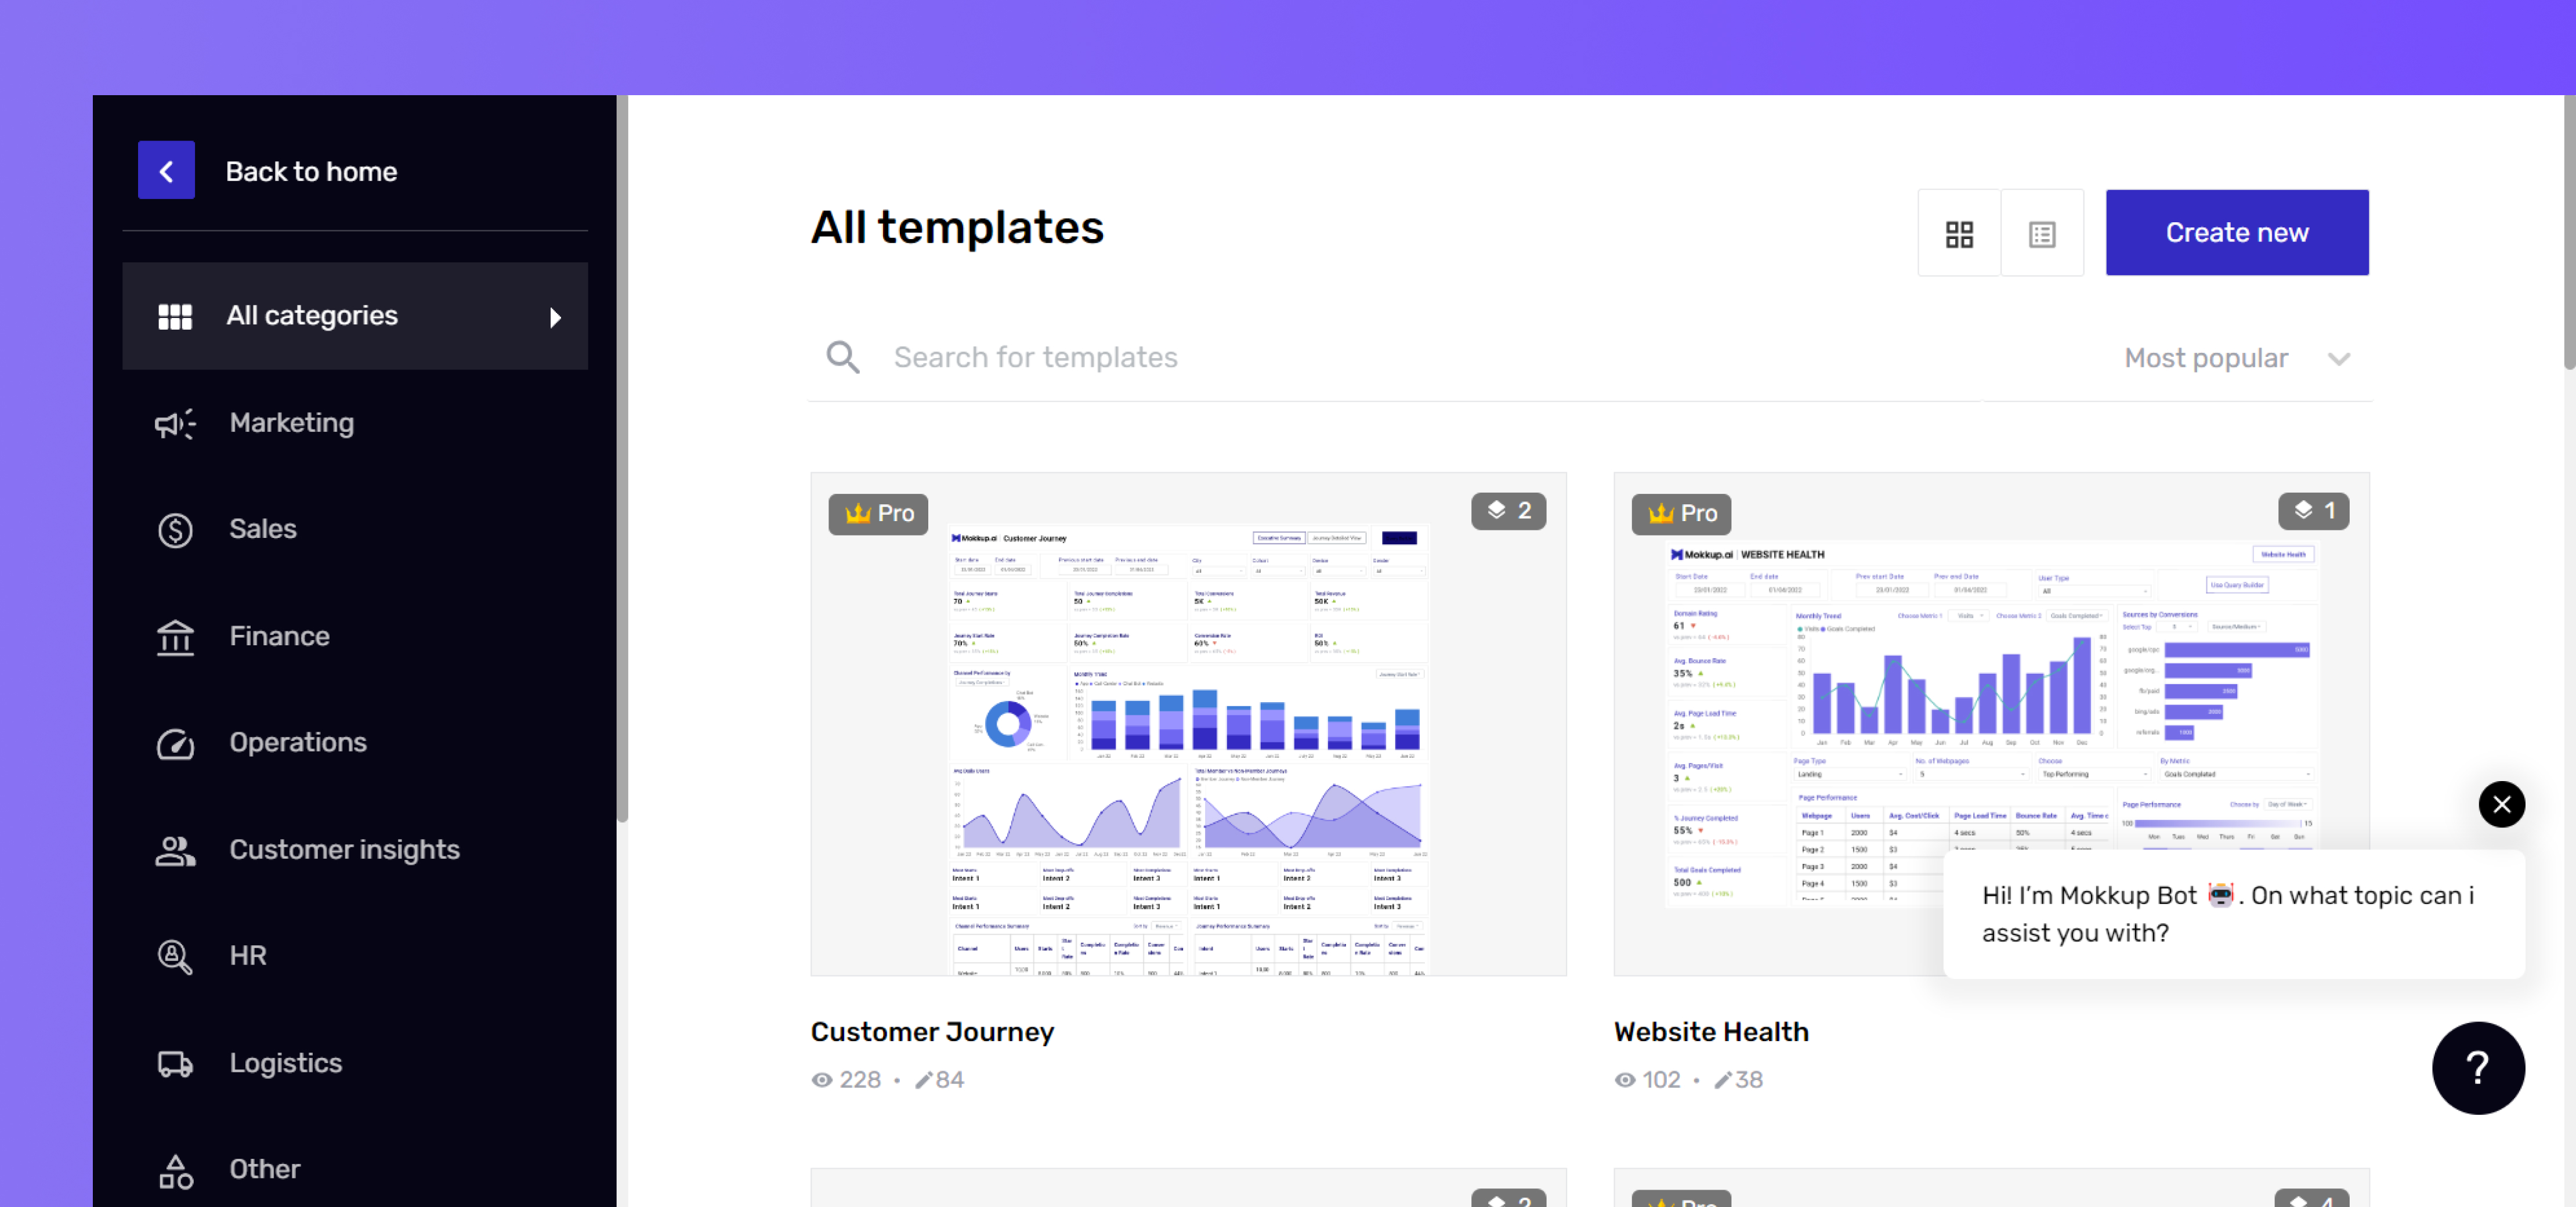
The templates option will take you to the “All Templates” page; you can scroll through the various templates across multiple categories.
4. Admin
In the Admin section, go to the “Billing” option to upgrade your plan and use the “Info” tab to update your billing details. You can track your individual plan and any other plans you are included in.
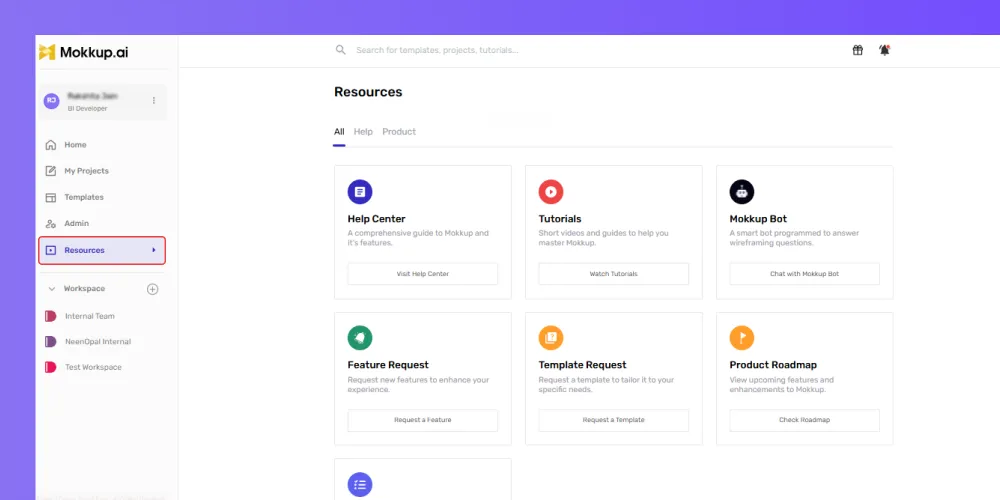
5. Resources
A dedicated section that provides video tutorials on creating Mokkup elements in BI tools like Power BI and Tableau. You'll also find resources on how to use Mokkup efficiently.
Navigation bar
The navigation bar runs along the top of the screen and stays with you as you move between Home, My Projects, Admin and Resources.
Search
Use the search bar on top to find anything on the platform. It covers templates, projects, and tutorials, not just templates.
Refer & earn
Click the gift icon to open the referral panel. The "Invite" tab holds your personal invite link. Use "Copy invite link," or share it straight to X, email, LinkedIn, Facebook, or as a QR code. You earn 10% of the revenue from anyone who signs up through your link, up to $100 per referral. The "Rewards" tab shows what you have earned so far.
Notifications
Click the bell icon to open your notifications. A red dot on the bell means something is unread, and the panel splits into "All" and "Unread" tabs. Workspace invitations land here too, so you can "Accept," "Decline," or "Join" a workspace without leaving the page.
From the Home page, you also have three quicker routes:
- Describe the dashboard you want in the prompt box and click "Generate," and Mokkup.ai will build the screen for you. Use the paperclip icon if you want to attach a file to work from.
- Pick one of the suggestions under the prompt box — "Financial Report," "Marketing Dashboard," or "Sales Analysis."
- Choose a card under "Get Started". For example, "Start from Scratch" for a blank canvas, "Explore Templates" to browse pre-built dashboards, or "Book A Demo" to schedule a 30-minute call with the team
Browse Categories
You can search for the different categories on the search bar or sort the categories from recent to most popular. Click the “View all” button to see all the categories & pre-built templates.
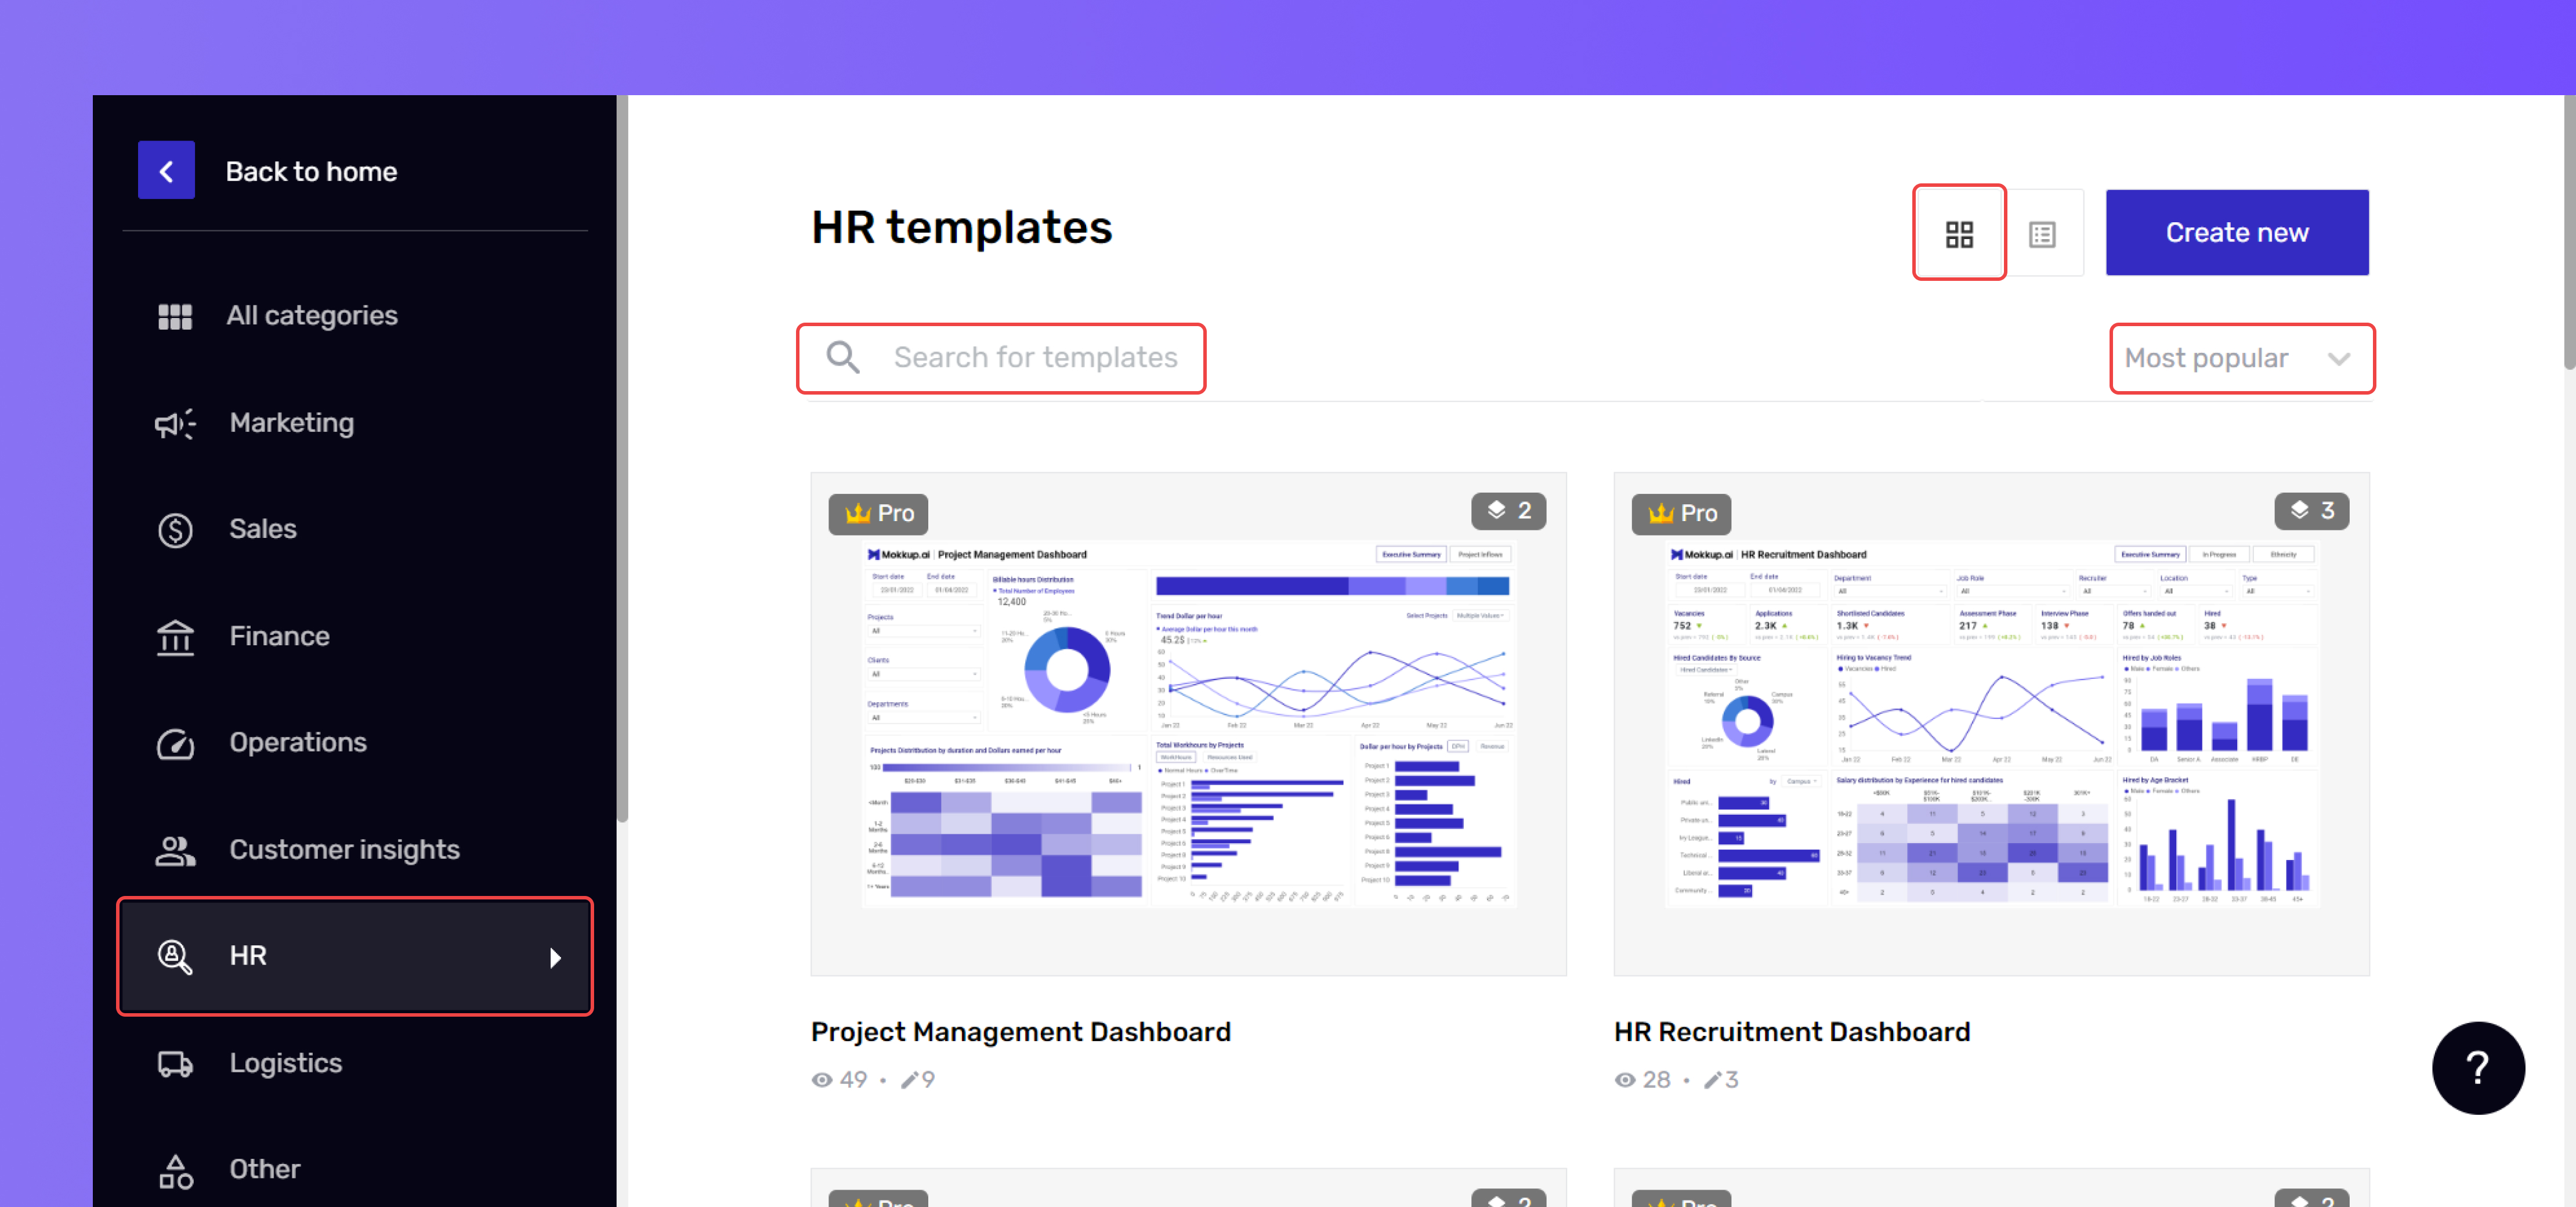
The left panel shows you the various categories of templates on Mokkup. For example, if you select the “HR” category, you can view all the “HR templates” for the same on the right.
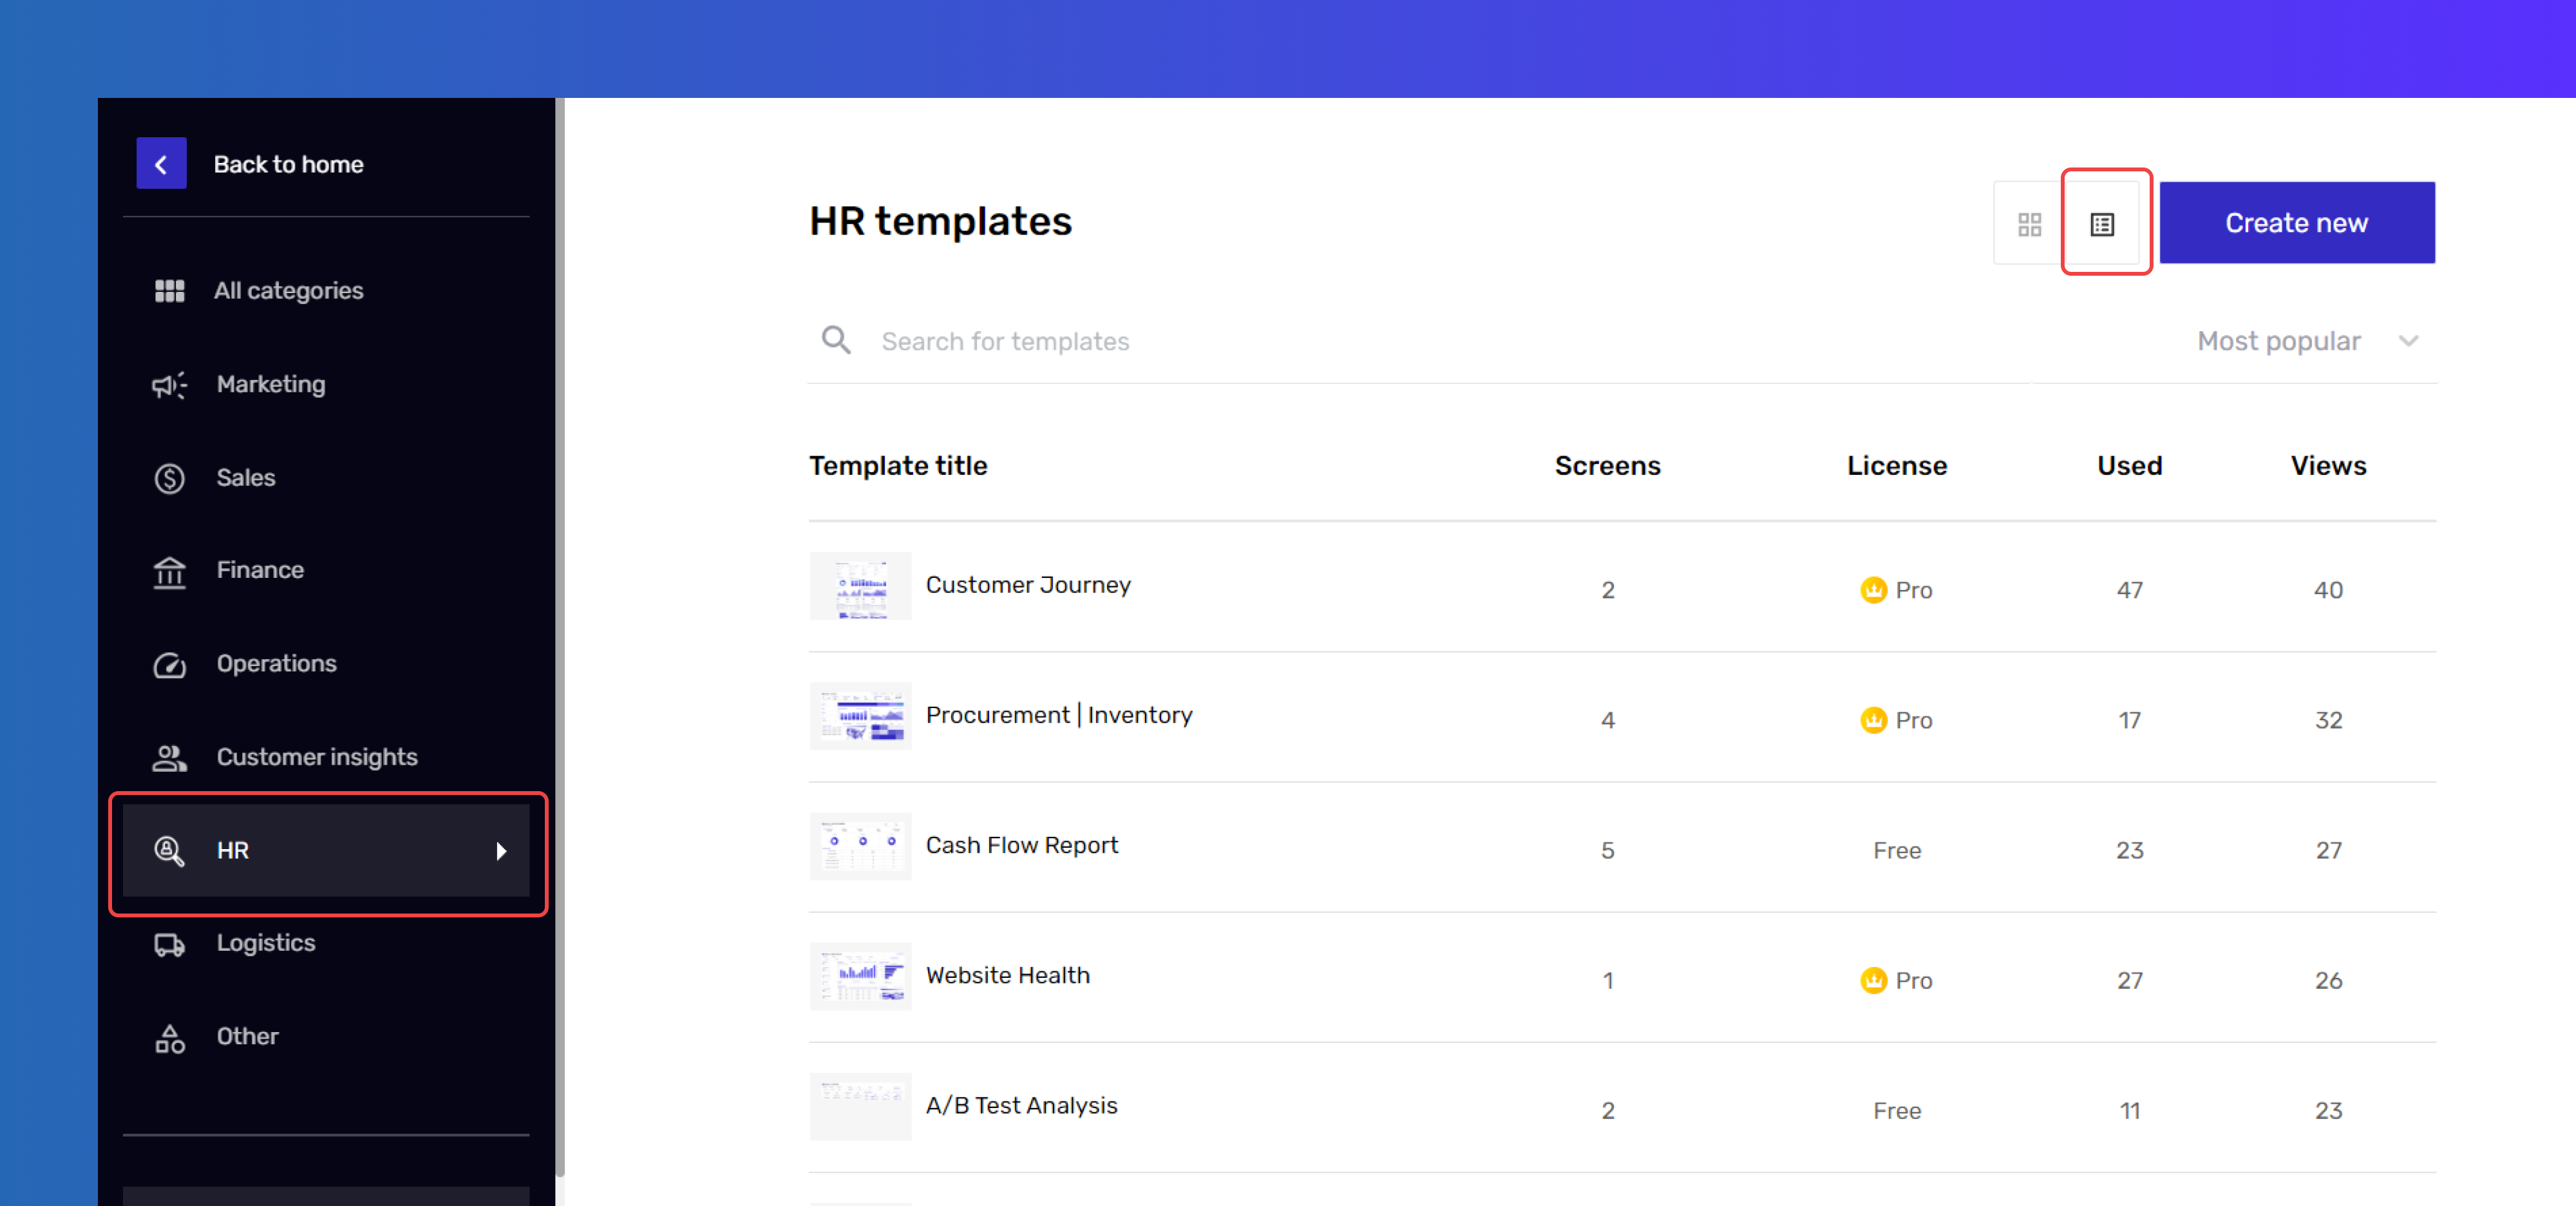
Also, you can change the page layout using the two icons on the left of the “Create new” button. The current page is set to the “Grid view.” To change the page layout from “Grid view” to “List view,” you can select the icon between the “Grid view” and “Create new” buttons. You can refer to the image shown below.
Browse Templates
To view more details about the template, you can select by clicking on the same and scrolling down to read about the dashboard details.
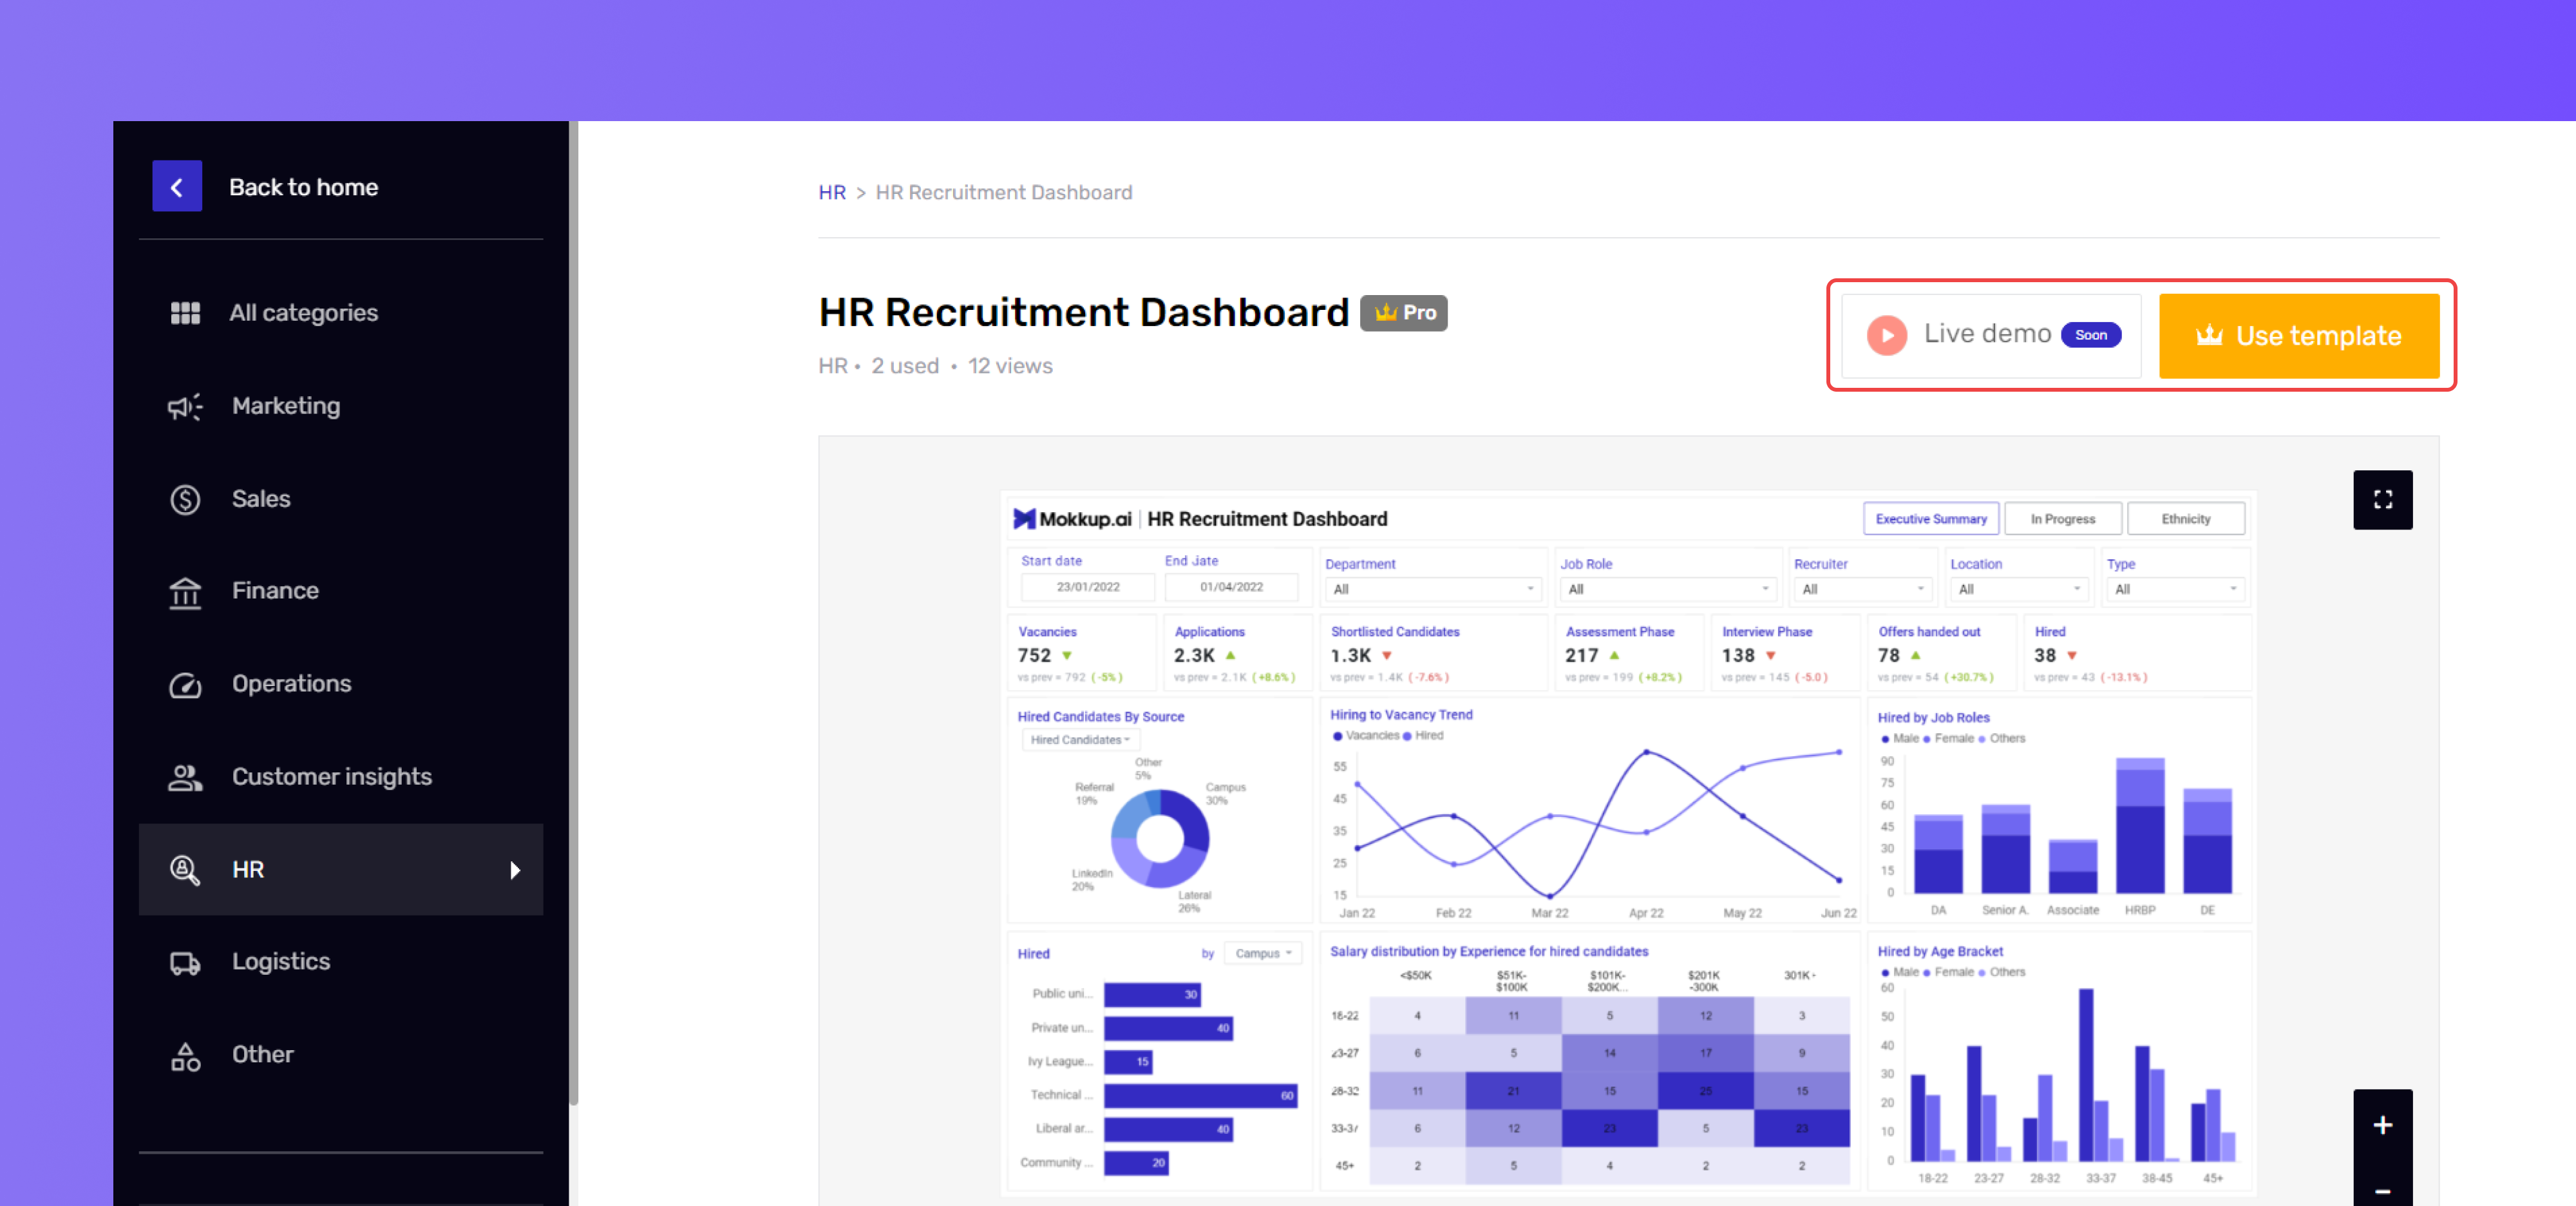
Click on “Live demo” to view the live data-connected versions of dashboards developed in a BI tool. Click on “Use template” to customize it according to your needs. As shown above.
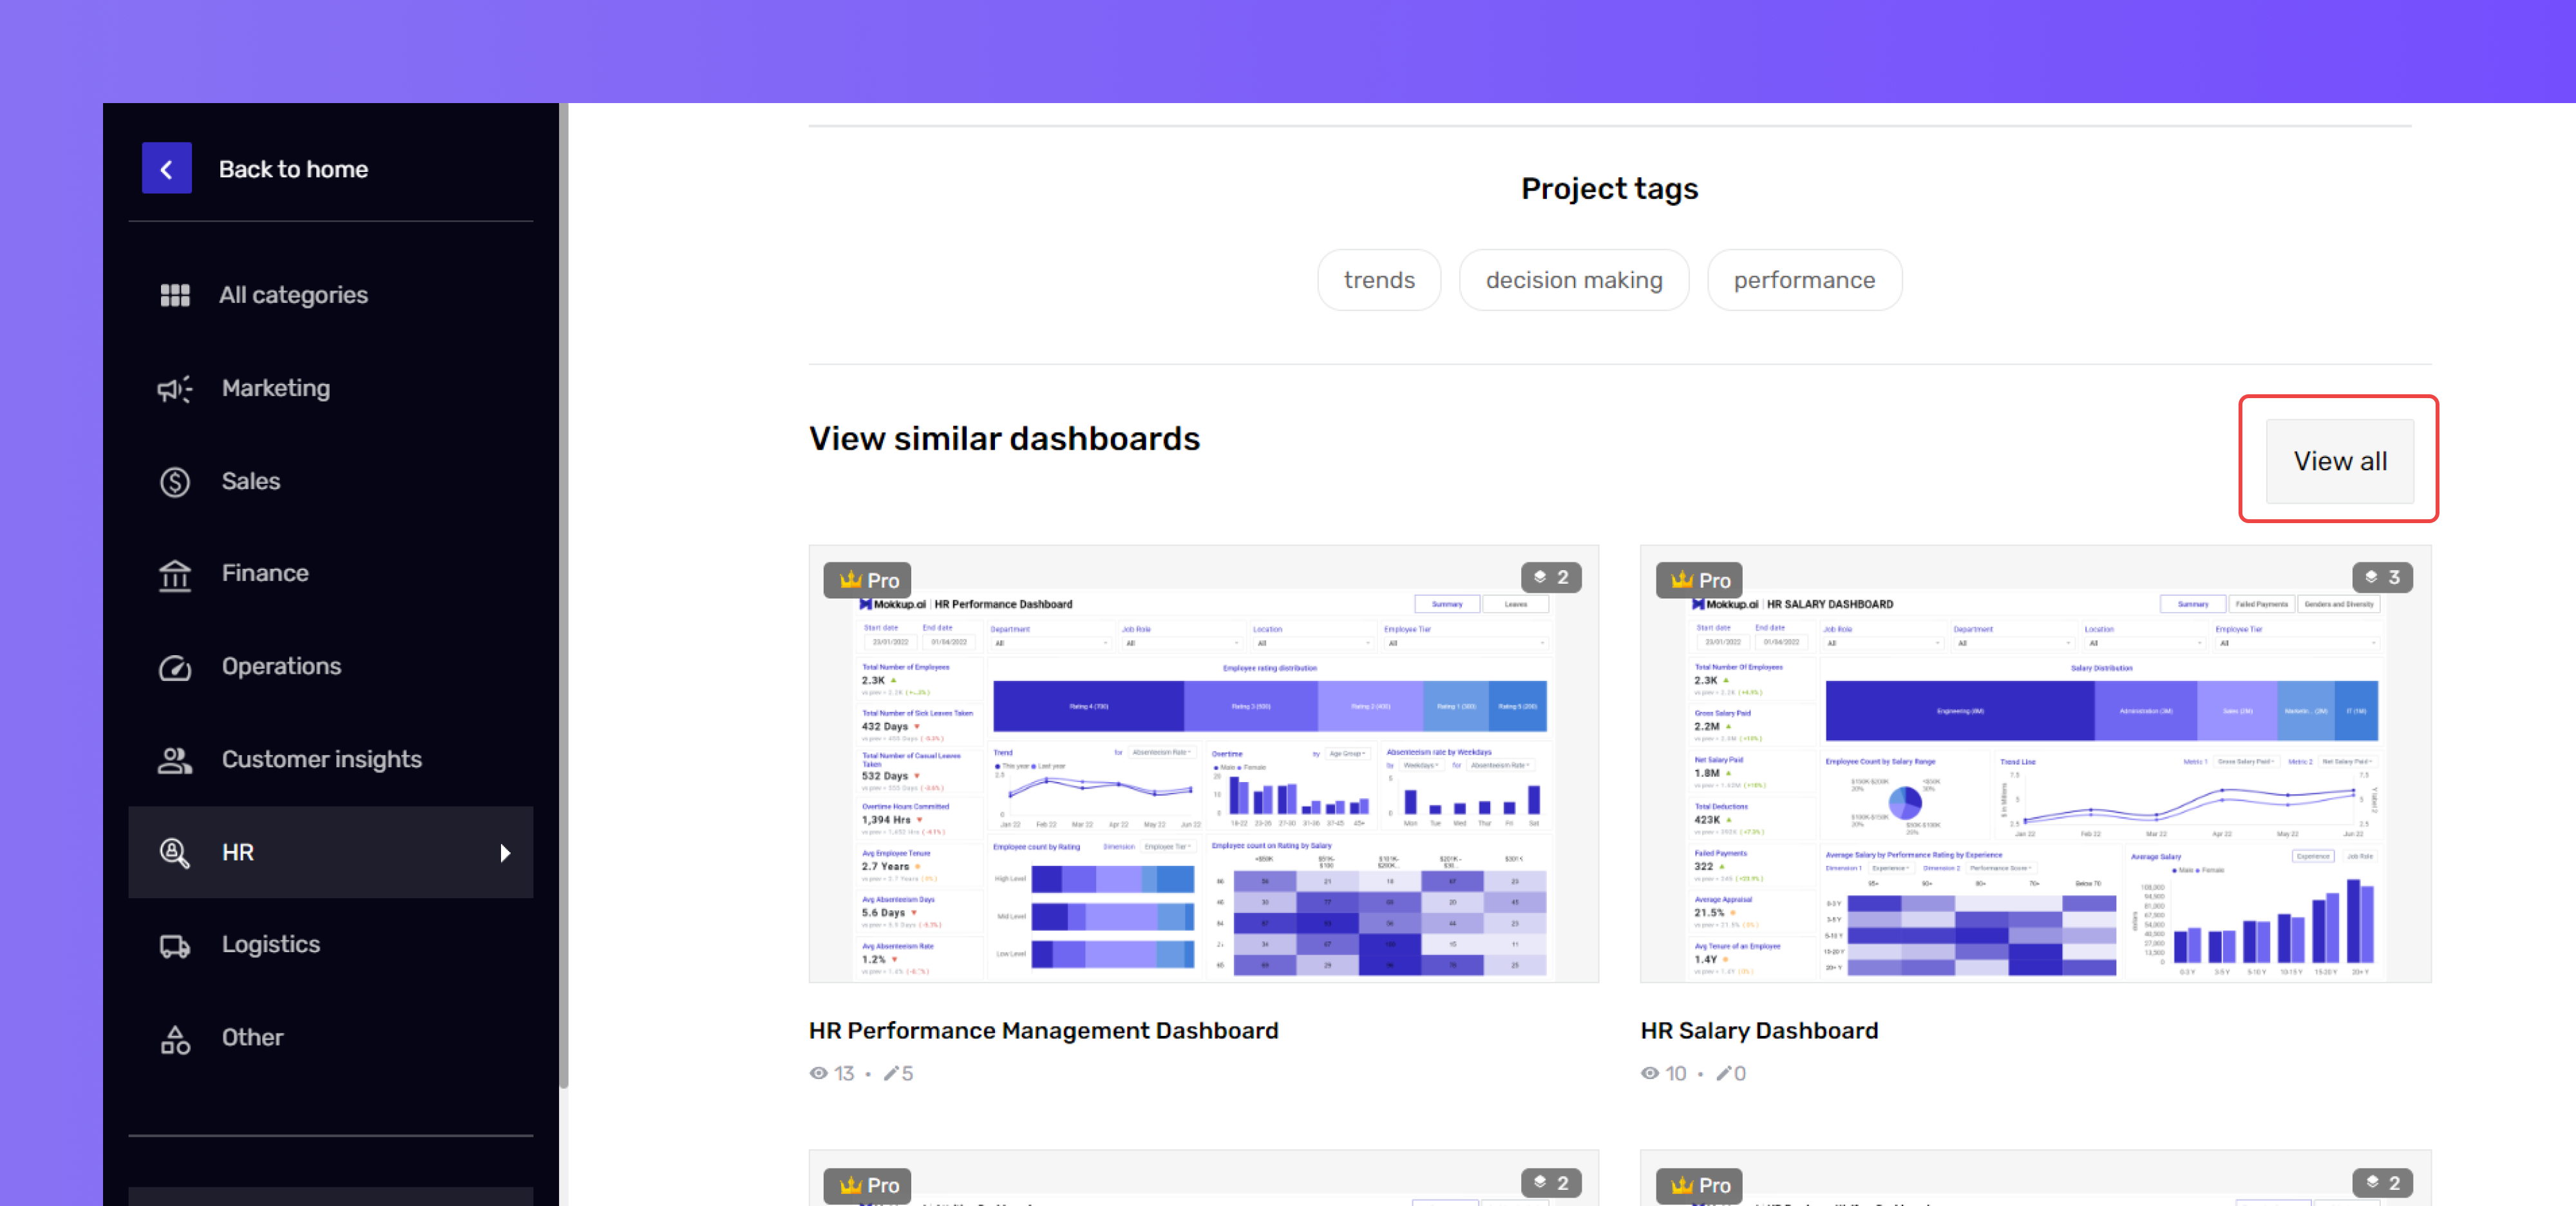
Scroll down on the template you like, and you'll reach the "View similar dashboards" section, with related options. Click "View all" to see the full list.