General Export Guide
When you export a wireframe from mokkup.ai into Power BI, it comes as a .pbit template file. This file contains the structure of your dashboards but relies on placeholder data. To make it fully functional, you’ll need to connect your own data, adjust the model, and fine-tune visuals.
This guide walks you through the process step by step.
1. Review the Exported File
-
Open the exported .pbit file in Power BI Desktop. Initially the file might appear empty, please allow a moment for Power BI to refresh the underlying data model before proceeding.
-
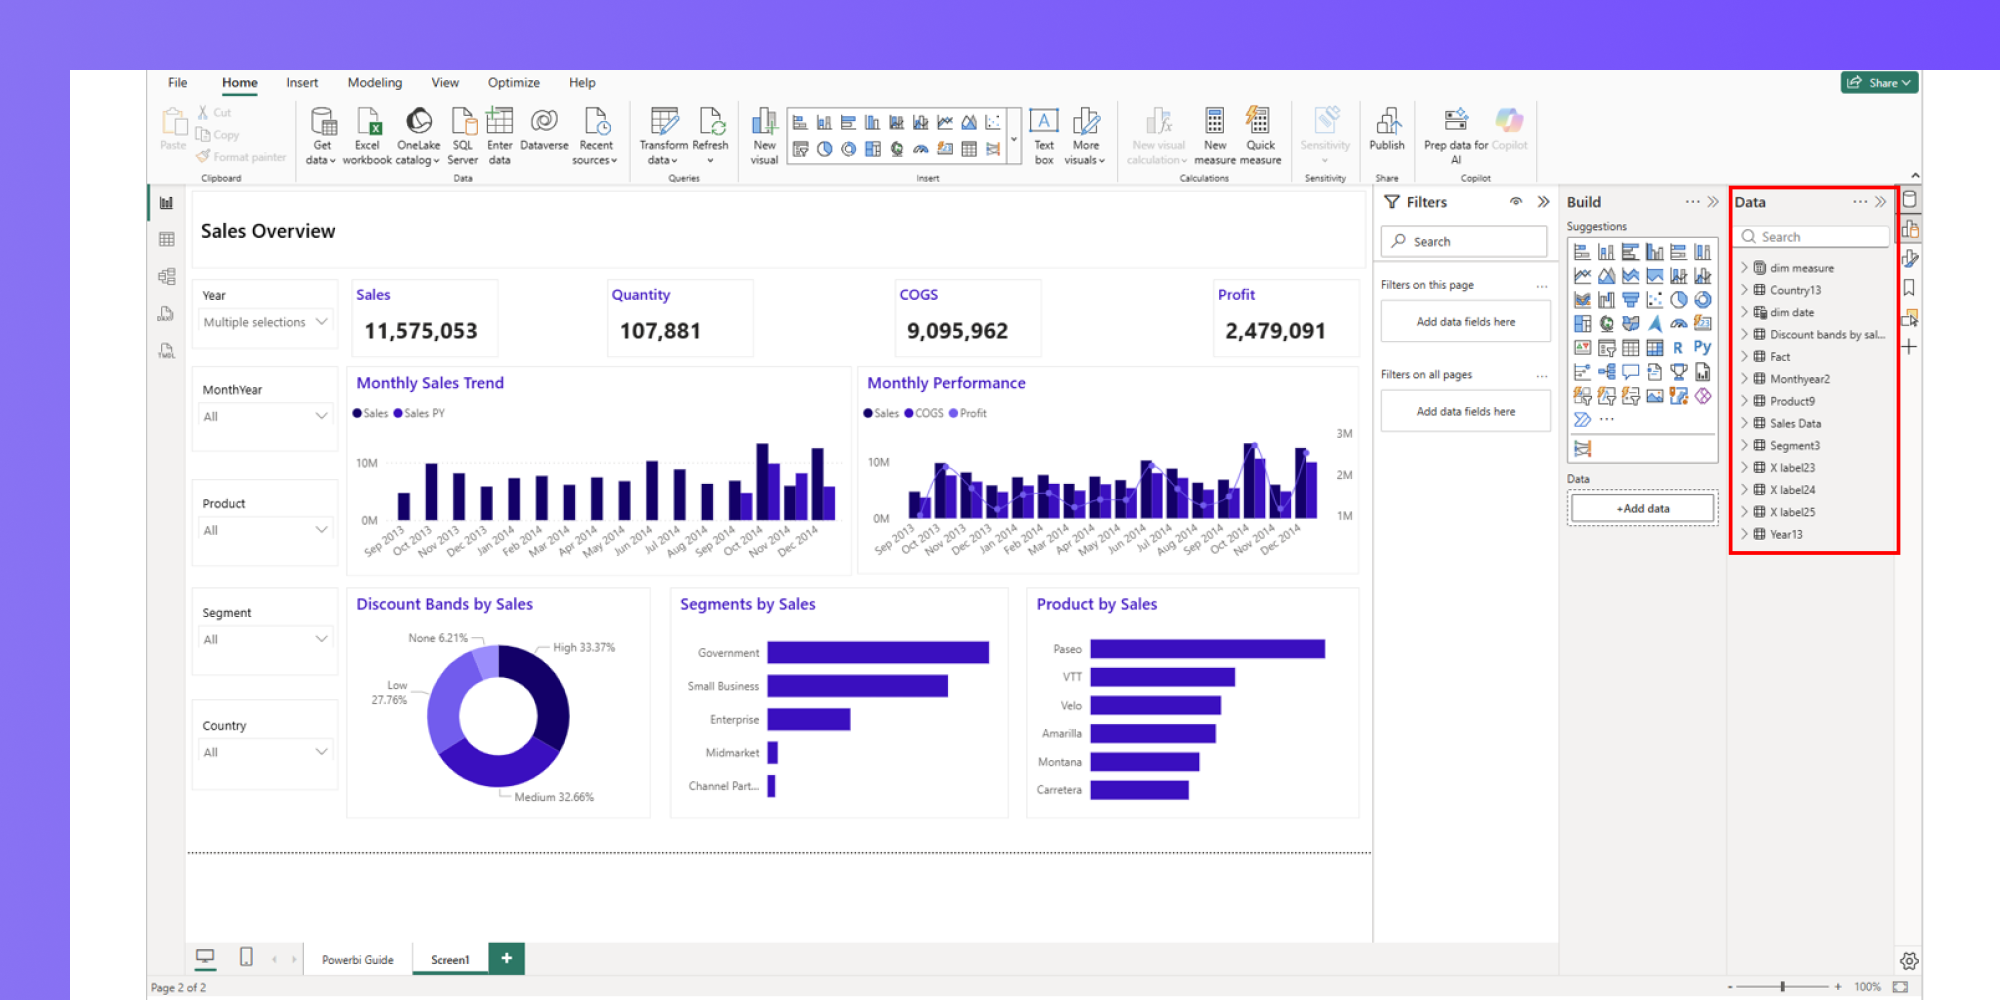
The data pane on the right lists down all the dummy tables used to create the visuals in the mokkup wireframe. Most of these tables contain placeholder data which needs to be replaced with the actual data once connected to the data source.
-
As per the exported data model, filters and slicers rely on master tables. You may see duplicates across pages (e.g., multiple “Product Category” tables).
-
Categorical fields (e.g., Product, Region) link to the Fact Table through an ID column. This ensures relationships follow best practice. Ignore the duplicate tables in this step as it will be handled during the final clean up phase.
-
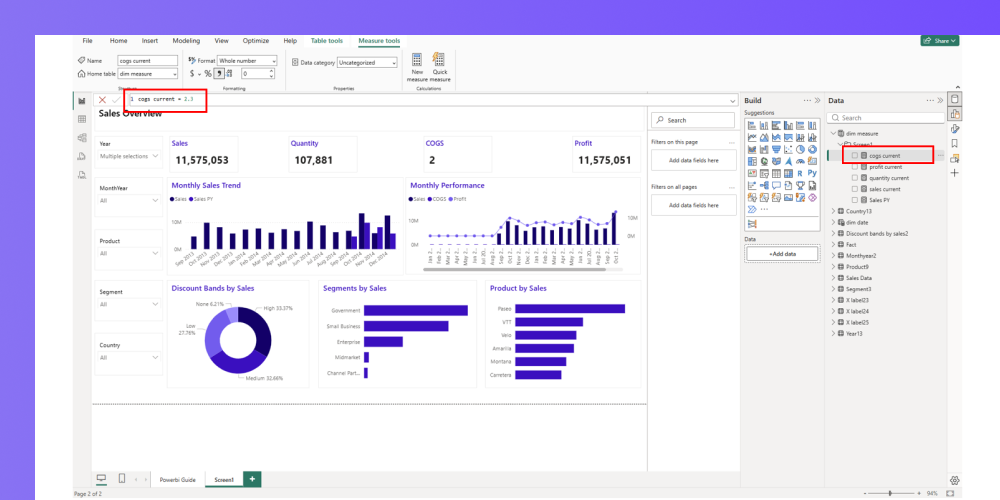
Cards and KPIs are created with fixed measures; they must later be replaced with dynamic business measures.
-
Expect minor layout adjustments—for example, chart titles may be cut off or visuals may appear too small. Resize them as needed.
2. Connect to Your Data Source
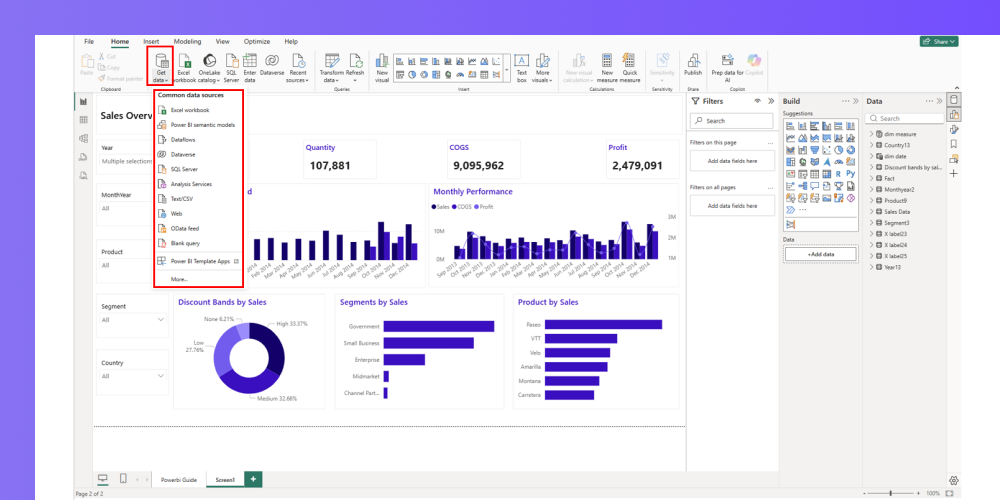
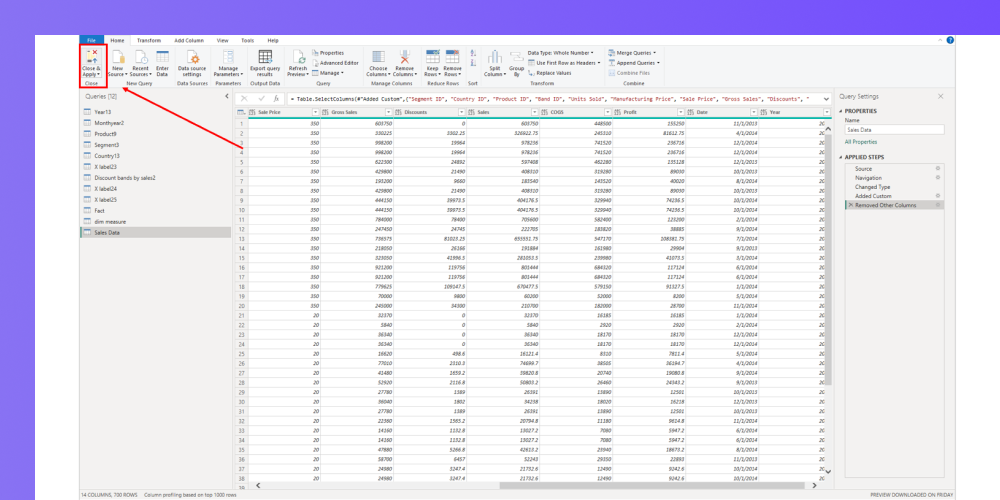
Use the Get Data option to connect to your data source and apply the required transformations in Power Query:
-
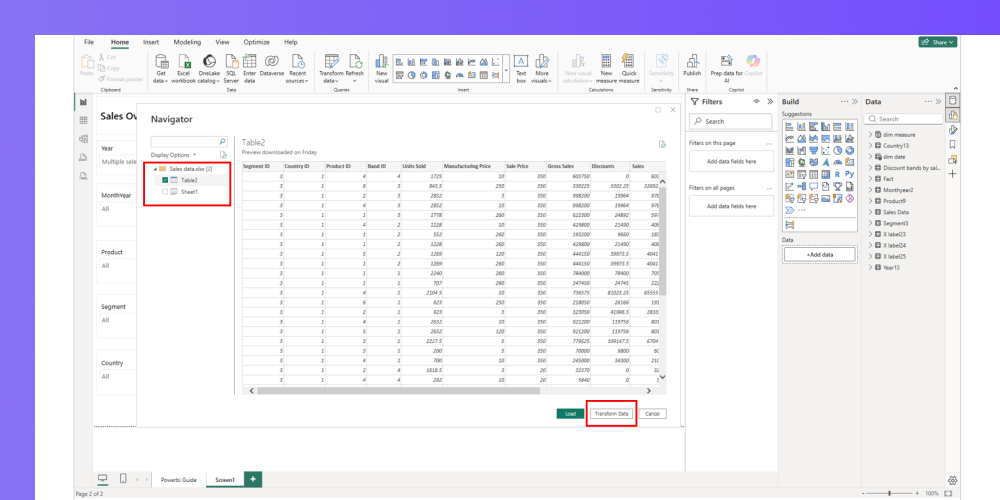
Select the data source from the dropdown and click on Transform Data to add the required transformation steps.
-
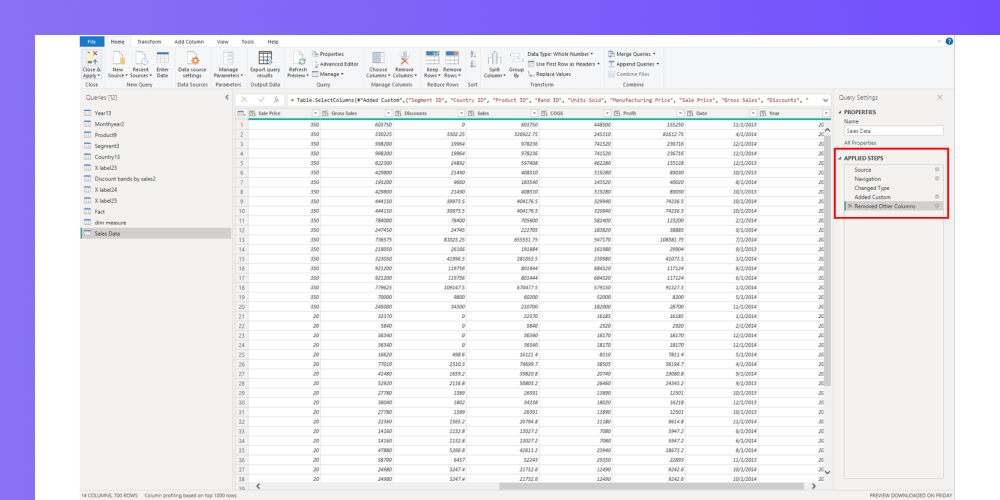
In this transformation step, change data types, create custom columns, format data, etc, as per requirement.
-
Load the transformed data in Power BI using “Close and Apply”.
-
In case of multiple source tables (fact and dimension tables), load all the required tables into Power BI.
-
If reusing a mokkup created table in the final report, update the name of the table as per suitable naming convention and remove any unused columns from the tables.
3. Validate the Data Model
-
After connecting your real data, check the relationships between tables.
-
Adjust the relationships between the required dimension tables and the newly added fact tables. Ignore the unrequired tables in this step and configure the data model basis the required tables.
-
Check and update the cardinality of new and existing relationships.
-
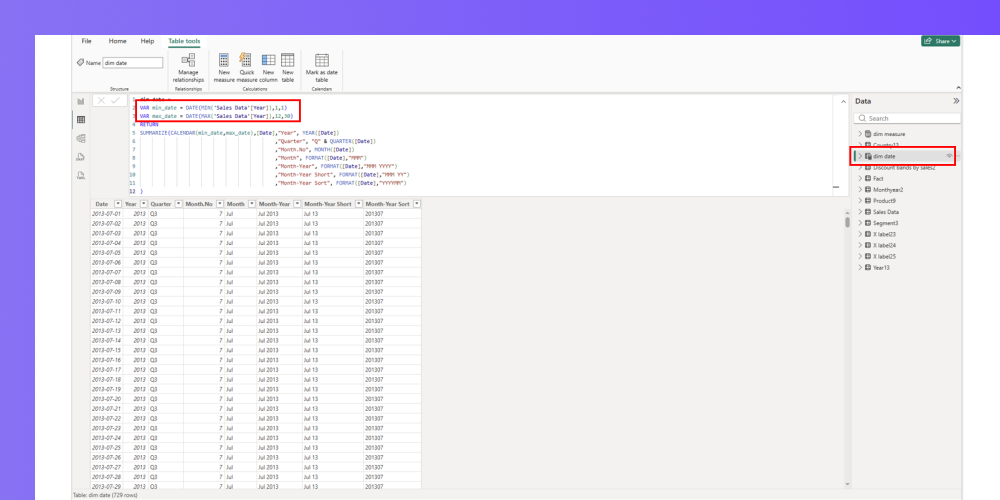
Update [dim date] table in the data model (If Present)
-
Update the [dim date] table to use the correct date range based on the fact table. Replace the min_date and max_date values in the dim date table to ensure the [dim date] table returns the correct date range based on your source data.
-
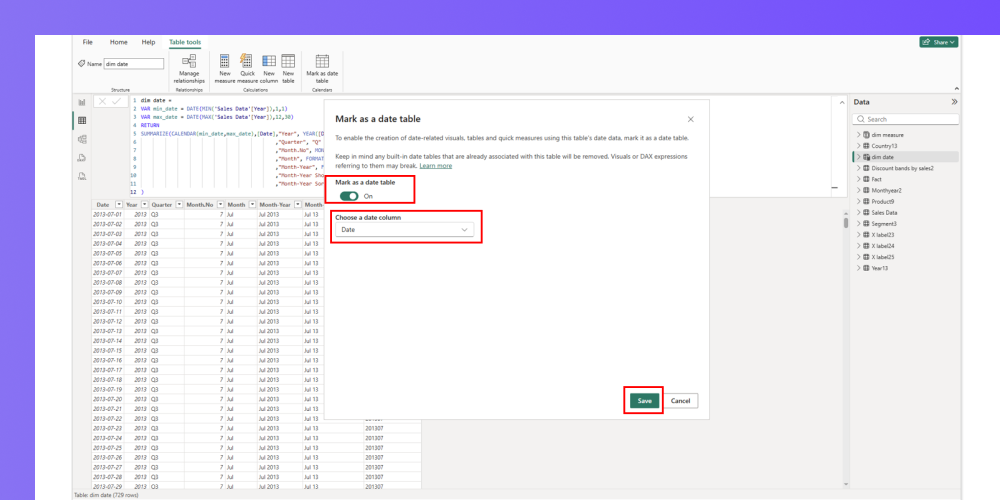
Mark the [dim date] table as the official Date table in the model to ensure all time intelligence functions (such as YTD, MTD and YoY calculations) work as expected.
-
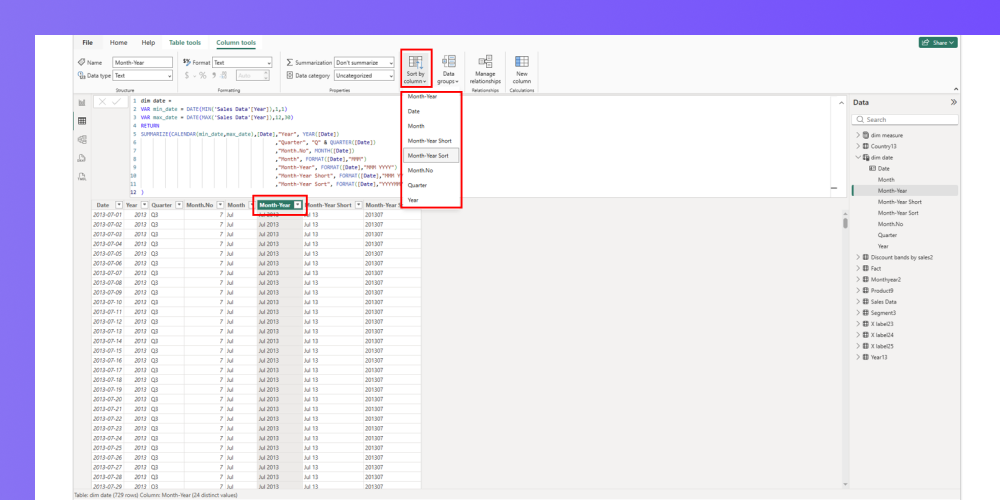
Additionally, sort the appropriate date column so that reports and visuals display dates in the proper chronological order instead of alphabetical order. (Note: Select the date field used in visuals from the [dim date] table and sort it in the correct order based on a numeric sorting field from the same table)
-
Re-categorize fields with special meaning:
- Geographical data: Country, City, Latitude/Longitude
- URLs: Image URL, Web URL
Setting the right categories enables maps, image rendering, and clickable links to work properly.
- Update Measures:
- Cards and KPIs are created as fixed measures during the export from Mokkup. Update the measures with the required logic and ensure correct fields from the dimension or fact tables are being used.
-
-
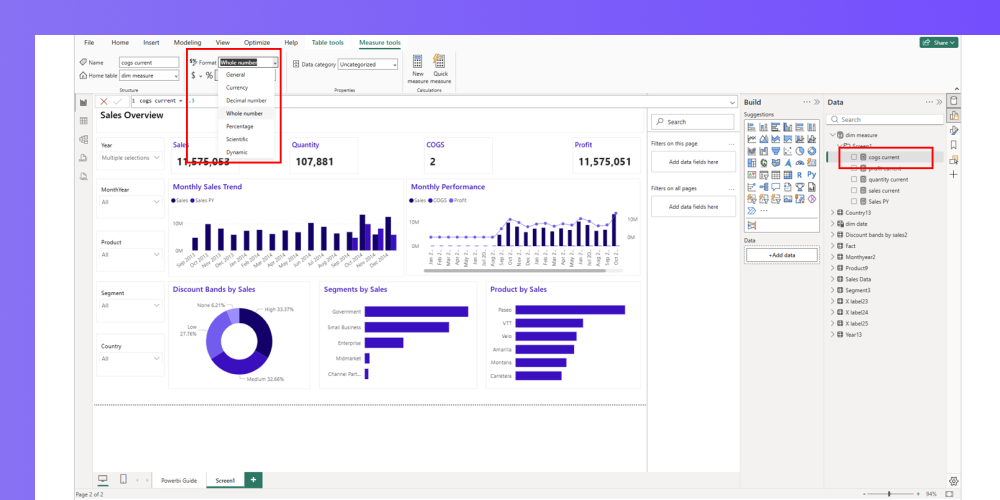
Once the business logic in the measures is updated, apply the required formatting (such as currency, whole number, text, etc.) to each measure.
-
4. Clean Up Pages & Visuals
- Page order may not match your mokkup wireframe. Re-order to match your intended navigation.
- Replace the placeholder fields in the visuals with the new fields from the fact table. Ensure that visuals pull data from the correct columns.
- Update slicers to use dimensions from the newly loaded tables.
- Static text or values: Many chart titles and card numbers are exported as plain text or fixed values. Replace these with dynamic measures written in DAX, ensuring they respond to filters.
- Bookmarks and navigation: These do not carry over from mokkup. Manually recreate them to allow smooth storytelling in your report.
5. Clean Up the Data Model
- Navigate to the model view to remove the extra dummy tables created during the mokkup export. Ensure that no critical fact or dimension tables are deleted during this clean up process.
6. Verify and Finalize Visuals
- Check for errors: If a visual shows an error (e.g., a missing field), replace the broken column/measure with one from your real model.
- Troubleshooting tip: Remove the problematic field and add it back from the correct table—this is often faster than fixing relationships.
- Advanced visuals (Sankey charts, Maps, Bubble charts): These often rely on precise field formatting. Test them carefully with your real data and adjust parameters as needed.
7. Save and Publish
- Once satisfied, save the file as a .pbix report.
- From here, you can publish to the Power BI Service and share dashboards with your team.
- Congratulations — your mokkup.ai wireframe is now a live, fully interactive report!
Handling the Cyclic Reference Error in Power BI
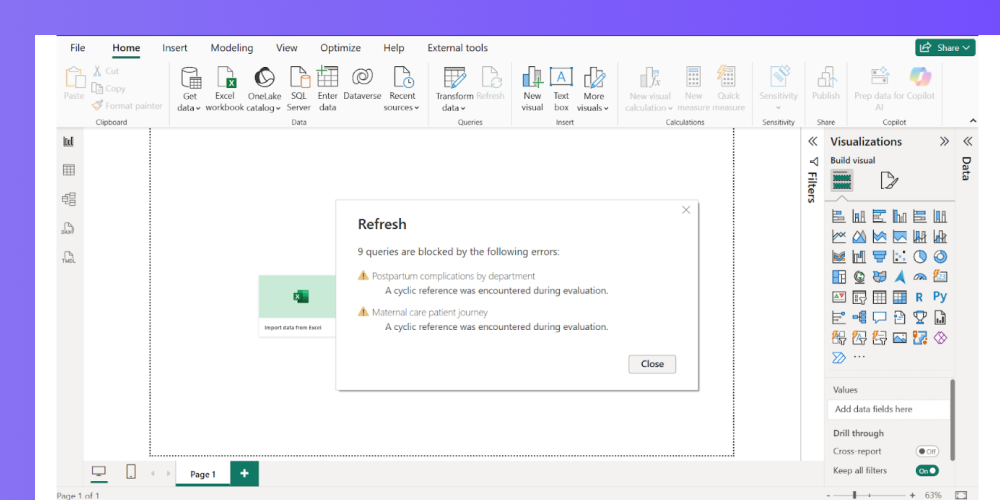
When you open a Mokkup-generated .pbit file in Power BI Desktop, you may occasionally see an error that reads something like: "A Cyclic reference was encountered during evaluation"
This is expected behavior in certain cases and does not mean your file is broken.
Why does this happen?
Power BI template files require a data refresh on first open to fully resolve all relationships and calculated columns. In some configurations, Power BI flags this as a cyclic dependency before the refresh completes — but once you refresh, it resolves itself automatically.
What to do
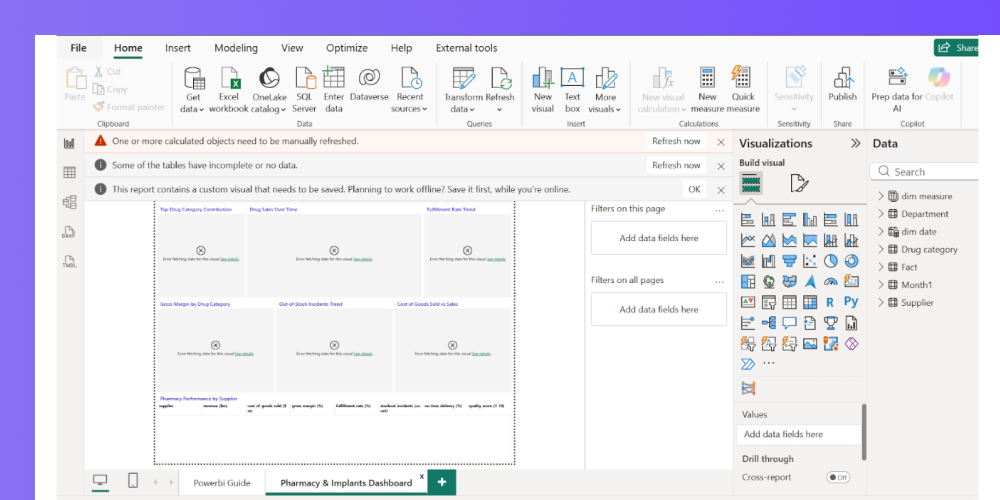
- Close the error dialog box.
- Once the error dialog is closed, you'll see a bar at the top. Click the "Refresh now" button on the right side of that bar.
- Power BI will refresh the data model and your visuals will load and the error icons on each chart will disappear once the refresh is done.
- If the error reappears, close the file, reopen it, and click Refresh Now again.
In most cases, a single refresh is all that's needed.
Frequently Asked Questions
1. What file format does mokkup.ai export for Power BI?
Mokkup.ai exports your dashboard wireframe as a .pbit (Power BI template) file. This includes the layout, visuals, and structure, but not your actual business data.
2. How do I connect my real data to the exported Power BI file?
In Power BI Desktop, go to Transform Data → Edit Queries, then replace the placeholder “Enter Data” source with your real data connection. Apply light transformations only.
3. I'm seeing a "A Cyclic reference was encountered during evaluation" error when opening my Power BI file. What should I do?
This is a known Power BI behavior that can occasionally occur when opening template files - it's not an issue with your design. Simply click "Refresh Now" on the error prompt and your file will load correctly. If the error appears again, close the file, reopen it, and click Refresh Now once more.