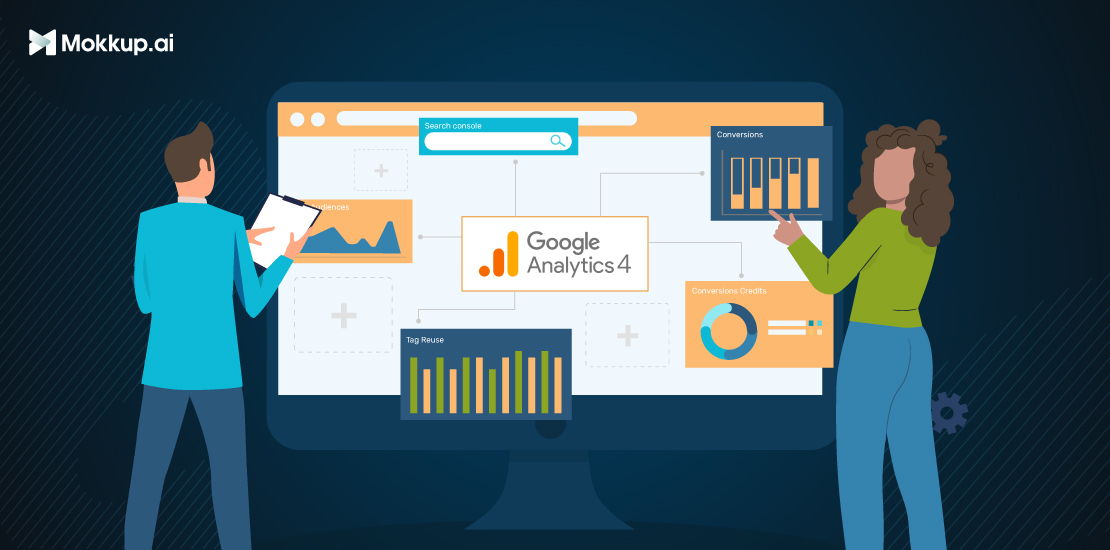
In our present digital world, everything changes in the blink of an eye. Data is the most important aspect of developing technological life, and it has grown essential for acquiring valuable insights.
Data analytics is a powerful aspect for businesses to find important trends, patterns, and preferences for informed decision-making. And at the peak of this digital revolution, data stands firmly at the top.
Here comes Google Analytics, a crucial tool that empowers businesses to measure and understand customer behavior like never before. It offers insightful data on user behavior, traffic patterns, the demographics of the audience, and much more. Companies can use Google Analytics to understand how customers interact with their online platforms. This information helps improve digital marketing strategies and enhance user experiences.
What is Google Analytics?
The incredibly powerful web analytics platform, Google Analytics, offers statistical insights into user behavior and interactions. Businesses use it to track and measure the performance of their websites and applications. It uses data's power to make decisions, improve marketing, and achieve important outcomes.
But exactly how does it function? Google Analytics 4 was introduced nearly three years ago with the goal of updating data measurement and boosting business success. It has the adaptability built in to measure various types of data and provide a powerful analytics experience.
Machine learning uses advanced technology to predict and provide new information, helping businesses stay current in the market. It also provides information on areas that need improvement, creating a better user experience across applications and websites.
Didn't I tell you that data is power? Google Analytics assists businesses by providing insights into their performance and areas for improvement - all of these through data. This valuable information or data enables businesses to enhance their strategies and foster growth.
How has GA4 evolved with time?
The powerful Google Analytics 4, or GA4, with its newest version, represents an evolution in data analytics skills. GA4 provides important advantages for businesses to better understand customer behavior and marketing efficiency in a changing landscape.
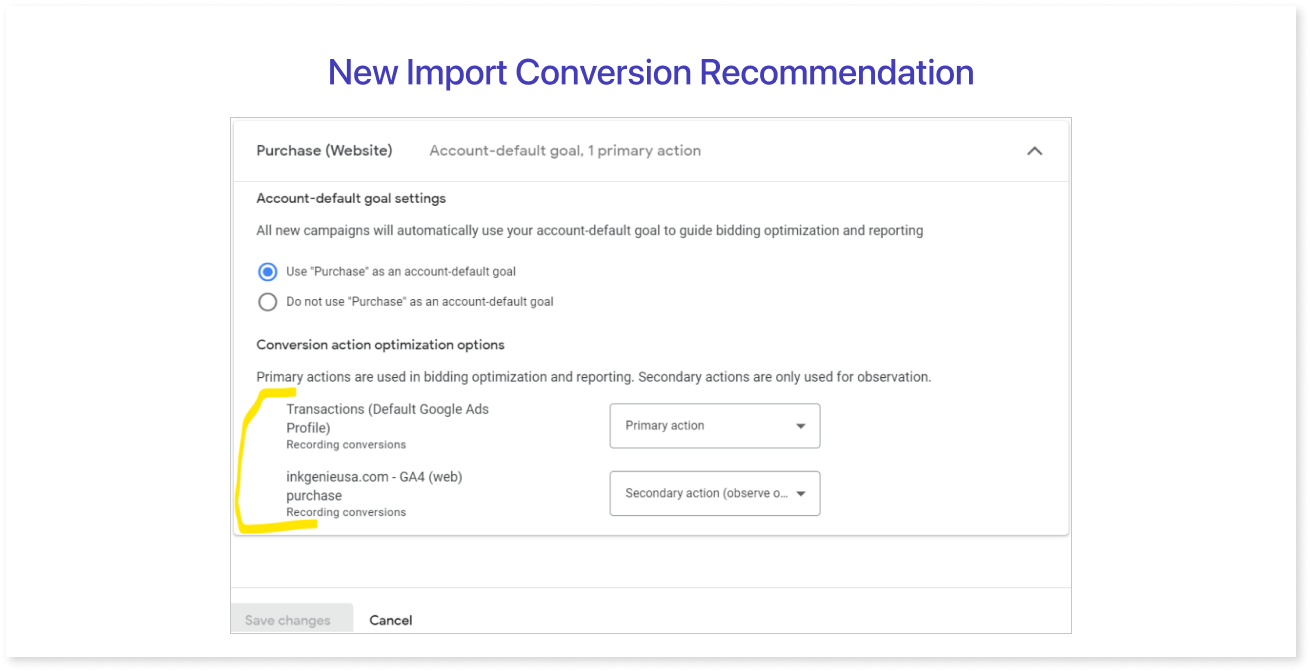
New Import Conversion Recommendation:
You can import your site and application conversions from Google Analytics 4 into Google Ads. It aids in improving and achieving better conversion rates.
This information could appear in multiple spots for Google Analytics accounts. The Marketing Snapshot screen, the homepage, or the Insights Hub page will prominently display your data. This ensures that you won't miss the opportunity to fully utilize it.
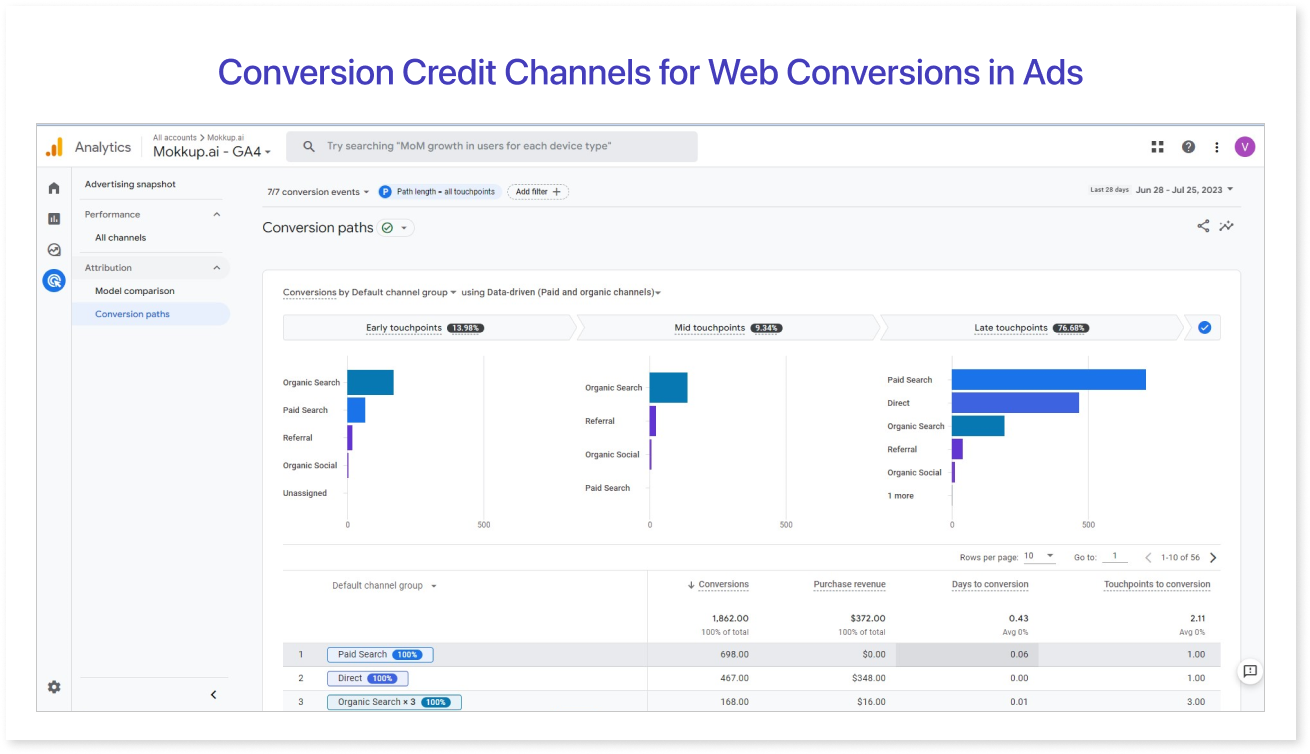
Conversion Credit Channels for Web Conversions in Ads:
You can now choose which channels get credit for online conversions linked to Google Ads. Google-sponsored channels (Ads-preferred) and organic channels (Cross-channel) are the alternatives that are accessible. Newly connected websites will, by default, have Google-sponsored channels chosen.
You can find conversion channels in Google Ads' Conversion Summary, Conversion Detail, and Campaigns tabs. You can also find them in Google Analytics' Attribution settings. Isn't that great? Changes you make in Google Analytics will affect future conversions because the setting is flexible.
Improved Tag Reuse for GA4 - Enhanced analytics.js Website Tags:
There are improvements made to enhance the reuse of analytics.js for users who switch from Universal Analytics to Google Analytics 4. You can now use your current tags through the newly added linked site tag capability.
It's exciting to note that they have made further improvements to this tag reuse feature. These changes make it simpler to gather improved e-commerce data, personalized measurements, metrics, and customized tag data for GA4 sites. As a consequence, consumers may now benefit from a more thorough and unique tracking experience while transitioning to GA4.
New Search Console Recommendation
Google now suggests connecting your disconnected Search Console account to Google Analytics for improved functionality. Users can gain advantages by connecting with new Search Console features like Google Organic Search Queries and Traffic. Now, you can better examine your search query and traffic with the help of these google analytics 4 reports.
Increased Capabilities for Building Audiences:
The addition of six new dimensions and indicators in Google Analytics 4 has improved the audience development experience. The platform's audience builder function now provides helpful data for segmenting and analyzing the audience.
Among the recently added dimensions are -
- Country: Based on the users' physical locations, analyze audience statistics.
- Manual term (UTM Term): Examine audience segmentation based on unique UTM keywords used for campaign tracking.
- Mobile device information: Gain insights into audience behavior specific to different mobile devices.
- Minute: A granular analysis of audience engagement by examining the duration of individual minutes spent on your website or app.
- New vs. Returning: Understand the composition of your audience by distinguishing between new and returning visitors.
Extension of the Properties & Sub-Properties Functionality in Google Analytics Account
Google Analytics has made significant upgrades, allowing users to register more Properties under one account. Previously, the standard limit for Properties was set at 100. However, the limit has been changed to 2000 Properties. Users can now freely organize their Properties without needing to ask for help to increase them.
In addition, Google Analytics has raised the maximum number of sub-properties one can assign to a single Property. The maximum number of sub-properties per google analytics 4 property is 400. If users need an increase over this limitation, they can contact support with their request.
Modify and create events with GA4
GA4 tracks user actions on websites and applications, providing data for analysis and gathering useful information. They provide information on the participation of users, such as the actions taken, the sites visited, and the features used. Businesses can acquire an in-depth understanding of user behavior, improve the user experience, and arrive at well-informed decisions. This will improve their marketing campaigns through efficient events tracking in ga4.
GA4 tracks user interactions as events. It analyzes these events and uses an event-driven data model. You can categorize events into three categories:
- GA4 tracks automatically gathered events without requiring extra installation, offering the most important understanding of user involvement and behavior.
- GA4 interface allows to create custom event in ga4. It also allows to activate Enhanced Measurement function, which automatically measures additional user behaviors, including clicking, scrolling, and video involvement.
- Customized events allow for the manual creation and installation of specific user interactions on a site or app. This helps gain a better understanding of user behavior and participation that aligns with the company's goals.
Effortless Insights with GA4 Enhanced Measurement
With Enhanced Measurement in GA4, your app can measure events and parameters automatically. It tracks important events like app installations, updates, user input, and errors, making it easy to keep a record. It tracks important events like app installations, updates, user input, and errors, making it easy to keep records.
In GA4 settings, you have the option to enable or disable Enhanced Measurement. You can also customize the tracking of events and variables according to your preferences. This tool saves you time by giving you helpful information about how users use your app. It makes analyzing data easier and helps you understand how users interact with your app.
Enhanced Measurement provides detailed stats, helping you make informed decisions and enhance your app's performance effectively.
Large-Scale Data Improvements in GA4
For properties with vast and complex data sets, this update has provided a better reporting mechanism. The updates include:
- Improved sample options.
- Larger data sets for Google Analytics 360 properties.
- We have improved privacy controls for collecting and sharing data.
- More accurate data integrity icons at each card level.
Users can get more precise insights and optimize data analysis - also increase reporting effectiveness through google analytics ga4 report template.
Good news! Google Analytics now has better privacy features, allowing companies to follow privacy rules like the GDPR. There are many more features than the ones mentioned above. To have a thorough understanding, you can visit the google analytics 4 guide.
Exploring Google Analytics 4 Dashboards with Mokkup.Ai
GA4 has added new features for a better user experience, and Mokkup has included the GA4 dashboard in its wireframing solution. You can easily create attractive dashboards using user-friendly tools. One can customize the interface, and ready-made KPIs are available.
Additionally, you can use drag-and-drop options. It gives the opportunity to visualize analytics before using Power BI or Tableau and streamline workflow to enhance products/services. But it doesn't end there; Mokkup’s google analytics 4 dashboard template features important website traffic performance information like audience maps and user activity.
Along with that, the google analytics 4 dashboard template shows information about the audience, like their age, gender, and where they are from.
Mokkup’s GA4 Website Analytics
For your data visualization, Mokkup’s seamless GA4 Website Analytics dashboard can be a big help. Our easy-to-use header helps you easily navigate and access important metrics and insightful data.
Track your website's performance with data visualization in Mokkup. See if you're meeting goals and monitor progress using advanced KPIs. Your data comes to life in our visually stunning charts and maps, allowing you to grasp complex insights at a glance.
Final Thoughts
It's fascinating that data representation and analysis can impact business intelligence and strategies in such a significant way, don't you think? To make the data explanation clear, following these steps is a must:
- Collect accurate information.
- Examine your areas for improvement using GA4's new features.
- Use the collected information to create a clear dashboard in Mokkup.ai with its array of templates and element options.
The future looks bright, as evidenced by the changing technological advancements - make data visualization better each day!
Prompt it. Wireframe it with Mokkup.ai.
