
Making well-informed choices quickly is essential for succeeding in today's data-driven business environment. Having said that, dashboards have changed how we see businesses. But what if we told you there was a method to increase their efficacy even more?
Benchmarking is a useful way to make business decisions and discover many possibilities and insights. Welcome to this world! Benchmarking is a strategy that helps organizations compare their performance to others in their industry.
Setting higher standards, promoting continuous improvement, and making data-driven choices that advance your business are all important.
Table of Content
- What is Benchmarking?
- The Power of Dashboard
- Real-Life Examples
- The Benchmarking Process
- Final Thoughts
What is Benchmarking?
Benchmarking is a vital and dynamic process that offers businesses valuable data and opportunities for growth. Benchmarked meaning, at its heart, is a methodical and organized approach that involves evaluating your organization's performance metrics, business operations, goods, or services with those of similar businesses or peers in the sector. It involves your dashboard benchmark evaluation and how you perform in several areas and determining how you may improve in those areas to reach your goal.
Benchmarking in dashboard analytics is your key to achieving just that. This effective tool comes with a wide range of advantages that could help you improve your company strategy and decision-making.

|
Trendspotting |
Growth Potential |
Market Position |
|
|
Benefits |
Use website analytics and traffic data to track consumer trends and market changes. |
Get a bird’s eye view of your market, including areas in which you have the potential to grow. |
Stay Relevant and competitive by tracking your market position. Monitor your traffic share to see if your digital activities are successful. |
|
Areas of Focus |
|
|
|
What are the types of benchmarking?
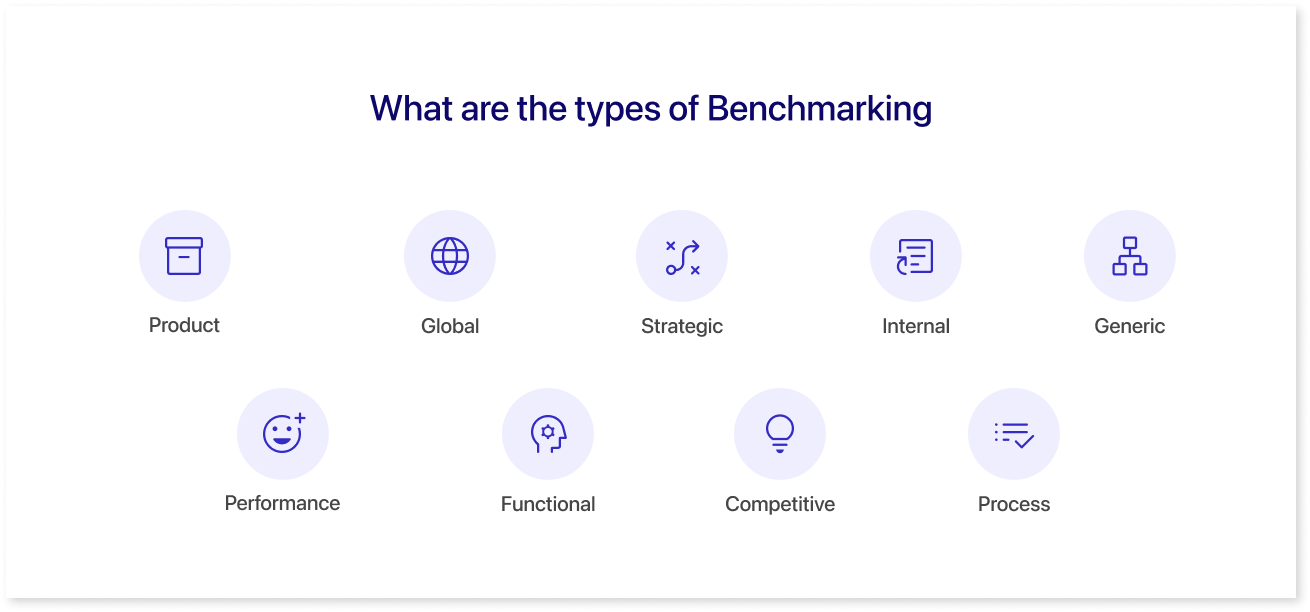
- Product - Product benchmarking involves comparing your goods or services with those of your rivals or leading businesses in your sector. Organizations can assess the standard, functions, cost, and general performance of their goods with this kind of benchmarking.
- Process - This focuses on assessing and enhancing particular company operations or procedures. Organizations compare their processes to top firms or industry peers to find inefficiencies, reduce costs, and simplify workflows.
- Competitive - It all comes down to directly contrasting the performance of your business with your rivals. Your overall market position, strengths, shortcomings, and potential for the difference are all revealed by this kind of benchmarking.
- Functional - It focuses on particular divisions or tasks inside your company. You can contrast your HR procedures, supply chain management, or client service to those of comparable businesses. This strategy promotes progress in certain areas and aids in the identification of optimal methods within those roles.
- Performance - We frequently compare key performance indicators (KPIs) to industry standards or top-performing businesses. Setting performance goals and tracking progress toward them are all made easier with the aid of performance benchmarking.
- Generic - Generic benchmarking draws inspiration from many sources outside your business. It involves evaluating companies that succeed in fields unrelated to your industry yet provide important information. By applying principles from other domains to your problems, generic benchmarking promotes creativity and innovation.
- Internal - Focuses on contrasting several divisions, groups, or branches inside your own company. It fosters information exchange and teamwork among internal stakeholders while assisting in the identification of performance gaps.
- Strategic - Strategic benchmarking examines your company's long-term goals and actions. We study the strategic planning and execution of businesses from diverse sectors. Strategic benchmarking improves your strategic vision and aligns it with best practices.
- Global - This goes beyond regional and domestic comparisons. It evaluates your worldwide performance against international rivals, industry trends, and best practices. Global benchmarking helps companies respond to global market problems and opportunities.
The Power of Dashboard
In this fluid environment, a dashboard, a powerful instrument for data analysis and visualization, is essential. It turns complex data sets from different sources into easy-to-understand visuals that provide helpful insights. Data becomes a tale waiting to be told through graphical representations and interactive features.
Dashboards' capacity to speed up decision-making is one of their most convincing benefits. Making timely judgments might be the difference between capturing a chance and missing it in a rapid business environment. By providing almost real-time updates, dashboard wireframes guarantee that decision-makers are always well-informed.
That being stated, wireframes are the core visual representations that designers and developers use to envision the layout and structure of dashboards, allowing for a faster transition from design conceptualization to final interactive dashboard implementation.
Benchmarking and Dashboards Work Well Together
Benchmarking and dashboard wireframes are a perfect match! They complement each other in several ways:
- Data Visualization: creates stunning visuals from raw data. Benchmarking data is easier to find and more relevant.
- Contextual Insights: Benchmarking offers data context. Benchmarking data on dashboard wireframes helps users compare their performance to industry standards.
- Timely Updates: Dashboards provide near-real-time updates. Users can often update benchmarking data, providing them with the latest information at their fingertips.
- Customization: Personalized dashboards can provide benchmarking metrics relevant to an industry's or organization's goals, improving their utility.
Benefits of Integrating Benchmarking into Your Dashboard Strategy
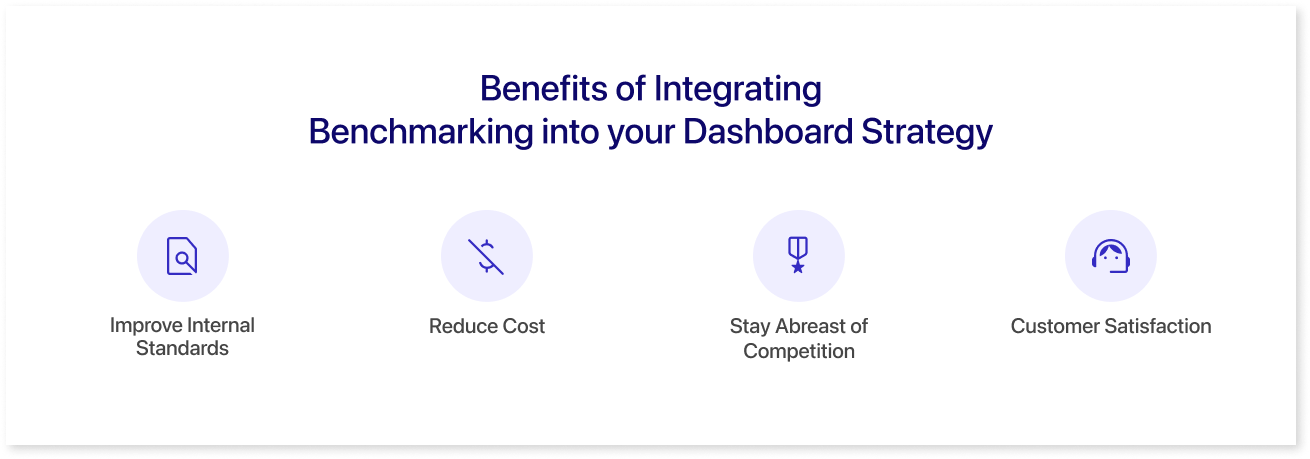
Improve Internal Standards:
- Analyzing competitor criteria and performance allows firms to enhance their internal standards.
- It promotes lean and agile execution, facilitating quick adaptation.
- Benchmarking creates strategic advantages, positioning firms ahead of competitors.
Reduce Costs:
- Organizations primarily use benchmarking to enhance efficiency, thereby impacting overall performance.
- Streamlining processes and optimizing operations helps cut costs by eliminating inefficiencies.
Stay Abreast of Competition:
- Staying informed about competitors' actions is crucial in today's tech-dependent world.
- Benchmarking aids in retaining a competitive edge by understanding competitors' successes and learning from their mistakes.
Customer Satisfaction:
- Positively perceiving and gathering customer feedback demonstrates a willingness to listen.
- It provides insights into areas where services may be lacking, improving efficiency and increasing overall customer satisfaction.
- Benchmarking can uncover valuable insights that might otherwise remain buried in extensive internal data.
Real-life Examples
Here are some benchmarking dashboard examples in real life:

- Google's advertising platform, Google Ads: Helps advertisers compare their advertising effectiveness to industry averages using benchmarking data. It display this information in user-friendly dashboards to assist marketers in optimizing their ads.
- Salesforce: A CRM leader, that offers benchmarking on its platform. Users can utilize dashboards to compare customer service and sales KPIs to industry benchmarks and make data-driven changes.
- Airbnb: Optimizes hosts' listings using benchmarking data. Dashboards show hosts how their prices, occupancy, and feedback compare to nearby properties. This allows hosts to improve property performance.
- Uber: To properly forecast prices, Uber's dashboard technique combines a variety of data sources, both internal and external. Uber uses GPS data, street traffic data, and custom algorithms to determine fair and accurate pricing for drivers and passengers.
- Zomato: Zomato helps restaurants improve and stay competitive by using data. They provide insights and suggestions for better performance and customer experience. This data-driven strategy maintains Zomato at the top of food technology and delivers value to businesses and customers.
The Benchmarking Process
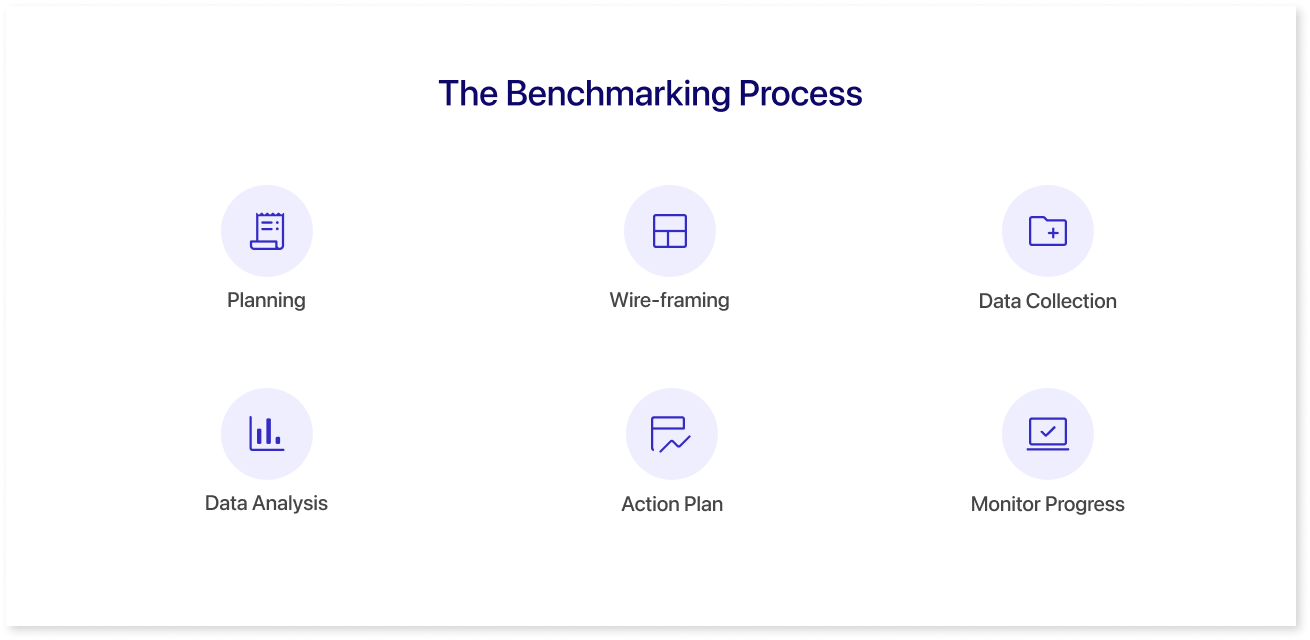
Benchmarking helps businesses evaluate their performance. It also helps them identify areas for improvement. Additionally, benchmarking allows businesses to adopt successful strategies from other companies or competitors. This process involves planning, data collection, analysis, action plan development, and monitoring progress.
- Planning: Benchmarking starts with deciding what you want to measure. When comparing activities and measuring success, be clear about compensation, sales, team building, or other areas of growth.
- Utilize Mokkup: After the planning stage visualize your dashboard concept and quickly create a wireframe. This choice helps you go from idea to finished product quickly. It also ensures that your dashboard is well-organized. To learn more, click here!
- Data Collection: Following the planning phase, the next step is gathering data on your processes and your rivals. At this time, it is important to gather as much data as possible.
- Data Analysis: Once you've acquired as much data as you can, you can start planning it out and spotting any vulnerabilities. Keep in mind that no business is perfect now and you must be open-minded to assess facts without bias. After gathering the information, prepare a report and initiate discussions on the subsequent steps to improve the performance of this area.
- Action Plan: You will create specific actions for you and your stakeholders to achieve goals during benchmarking. Defining success and planning ahead can keep you focused on reaching your goals. KPIs come into play in this situation because you can use them to carry out your action plan.
- Monitor Progress: One never assesses the effectiveness of a strategy until monitoring its results. Monitoring the changes during implementation, which will include KPIs and deadlines, is the only way to assess their efficacy. Monitoring can be short or long-term, depending on goals.
Final Thoughts
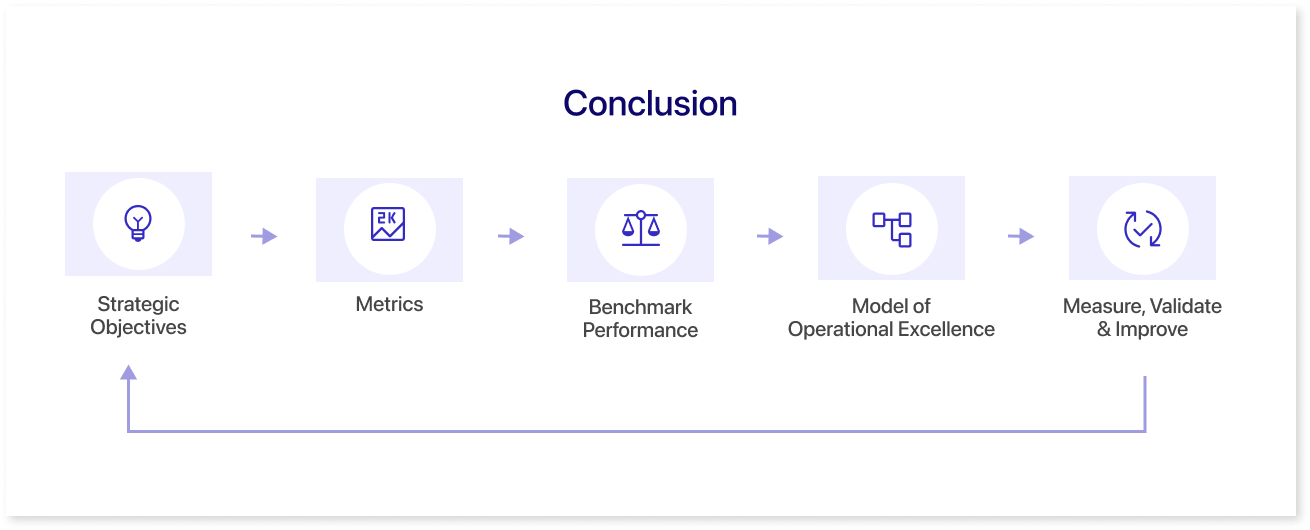
It is important to understand the significant influence benchmarking may have on improving dashboard effectiveness. Benchmarking is an active approach to innovation and development, not a passive activity.
To improve dashboards, benchmarking is important. Let's summarize the main lessons learned and highlight its significance.
- Benchmarking is a road to excellence, not merely a comparison. It helps companies analyze, adapt, and innovate in a changing business environment.
- Dashboards transform complicated data into meaningful insights. They provide real-time visibility into your company's performance.
- When benchmarking and dashboards combine, the possibilities are endless. Benchmarking data in dashboards improves data visualization, accelerates decision-making, and incorporates industry best practices.
- Benchmarking improves decision-making, performance monitoring, improvement areas, and corporate objectives.
Prompt it. Wireframe it with Mokkup.ai.
